African vs Immigrants from Eastern Europe No Vehicles in Household
COMPARE
African
Immigrants from Eastern Europe
No Vehicles in Household
No Vehicles in Household Comparison
Africans
Immigrants from Eastern Europe
12.3%
NO VEHICLES IN HOUSEHOLD
0.4/ 100
METRIC RATING
265th/ 347
METRIC RANK
13.6%
NO VEHICLES IN HOUSEHOLD
0.0/ 100
METRIC RATING
285th/ 347
METRIC RANK
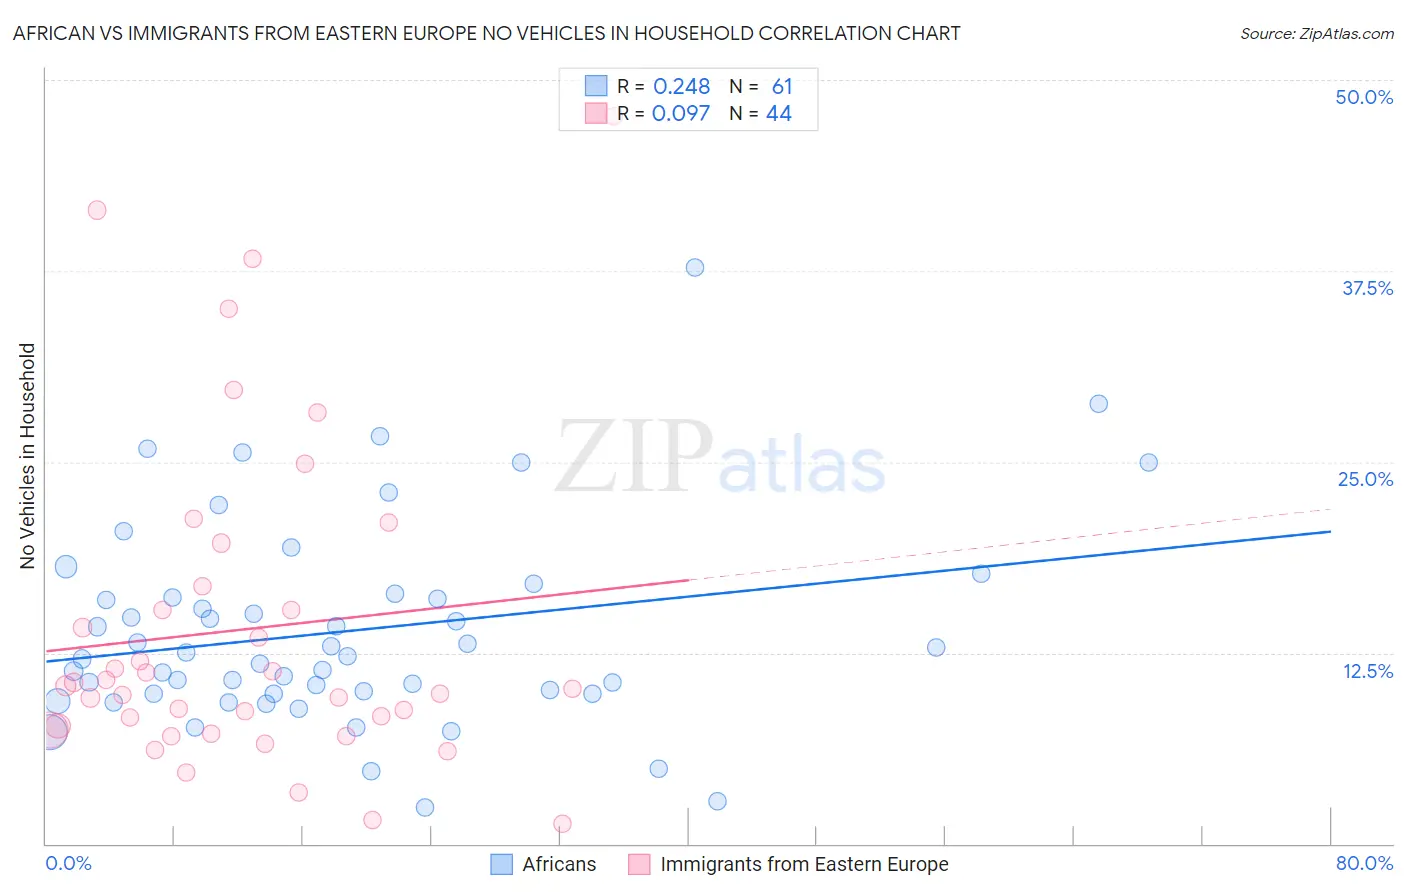
African vs Immigrants from Eastern Europe No Vehicles in Household Correlation Chart
The statistical analysis conducted on geographies consisting of 468,587,703 people shows a weak positive correlation between the proportion of Africans and percentage of households with no vehicle available in the United States with a correlation coefficient (R) of 0.248 and weighted average of 12.3%. Similarly, the statistical analysis conducted on geographies consisting of 473,883,384 people shows a slight positive correlation between the proportion of Immigrants from Eastern Europe and percentage of households with no vehicle available in the United States with a correlation coefficient (R) of 0.097 and weighted average of 13.6%, a difference of 10.3%.
No Vehicles in Household Correlation Summary
| Measurement | African | Immigrants from Eastern Europe |
| Minimum | 2.4% | 1.3% |
| Maximum | 37.8% | 47.6% |
| Range | 35.4% | 46.3% |
| Mean | 13.9% | 14.0% |
| Median | 12.3% | 10.3% |
| Interquartile 25% (IQ1) | 9.8% | 7.6% |
| Interquartile 75% (IQ3) | 16.3% | 16.1% |
| Interquartile Range (IQR) | 6.4% | 8.5% |
| Standard Deviation (Sample) | 6.7% | 10.6% |
| Standard Deviation (Population) | 6.6% | 10.5% |
Demographics Similar to Africans and Immigrants from Eastern Europe by No Vehicles in Household
In terms of no vehicles in household, the demographic groups most similar to Africans are Israeli (12.4%, a difference of 0.96%), Immigrants from Europe (12.5%, a difference of 1.5%), Immigrants from Africa (12.5%, a difference of 1.6%), Panamanian (12.5%, a difference of 1.7%), and Immigrants from Northern Africa (12.6%, a difference of 2.3%). Similarly, the demographic groups most similar to Immigrants from Eastern Europe are Immigrants from Malaysia (13.6%, a difference of 0.050%), Immigrants from Kazakhstan (13.6%, a difference of 0.30%), Immigrants from Eastern Asia (13.5%, a difference of 0.33%), Central American Indian (13.3%, a difference of 1.8%), and Alsatian (13.2%, a difference of 3.3%).
| Demographics | Rating | Rank | No Vehicles in Household |
| Africans | 0.4 /100 | #265 | Tragic 12.3% |
| Israelis | 0.3 /100 | #266 | Tragic 12.4% |
| Immigrants | Europe | 0.3 /100 | #267 | Tragic 12.5% |
| Immigrants | Africa | 0.2 /100 | #268 | Tragic 12.5% |
| Panamanians | 0.2 /100 | #269 | Tragic 12.5% |
| Immigrants | Northern Africa | 0.2 /100 | #270 | Tragic 12.6% |
| Immigrants | Morocco | 0.2 /100 | #271 | Tragic 12.6% |
| Bermudans | 0.1 /100 | #272 | Tragic 12.8% |
| Immigrants | France | 0.1 /100 | #273 | Tragic 12.9% |
| Immigrants | Singapore | 0.1 /100 | #274 | Tragic 12.9% |
| Immigrants | Albania | 0.1 /100 | #275 | Tragic 13.0% |
| Immigrants | Southern Europe | 0.1 /100 | #276 | Tragic 13.0% |
| Aleuts | 0.1 /100 | #277 | Tragic 13.0% |
| Immigrants | Croatia | 0.1 /100 | #278 | Tragic 13.0% |
| Mongolians | 0.0 /100 | #279 | Tragic 13.1% |
| Alsatians | 0.0 /100 | #280 | Tragic 13.2% |
| Central American Indians | 0.0 /100 | #281 | Tragic 13.3% |
| Immigrants | Eastern Asia | 0.0 /100 | #282 | Tragic 13.5% |
| Immigrants | Kazakhstan | 0.0 /100 | #283 | Tragic 13.6% |
| Immigrants | Malaysia | 0.0 /100 | #284 | Tragic 13.6% |
| Immigrants | Eastern Europe | 0.0 /100 | #285 | Tragic 13.6% |