Vietnamese vs Puerto Rican Cognitive Disability
COMPARE
Vietnamese
Puerto Rican
Cognitive Disability
Cognitive Disability Comparison
Vietnamese
Puerto Ricans
17.7%
COGNITIVE DISABILITY
3.4/ 100
METRIC RATING
225th/ 347
METRIC RANK
19.2%
COGNITIVE DISABILITY
0.0/ 100
METRIC RATING
339th/ 347
METRIC RANK
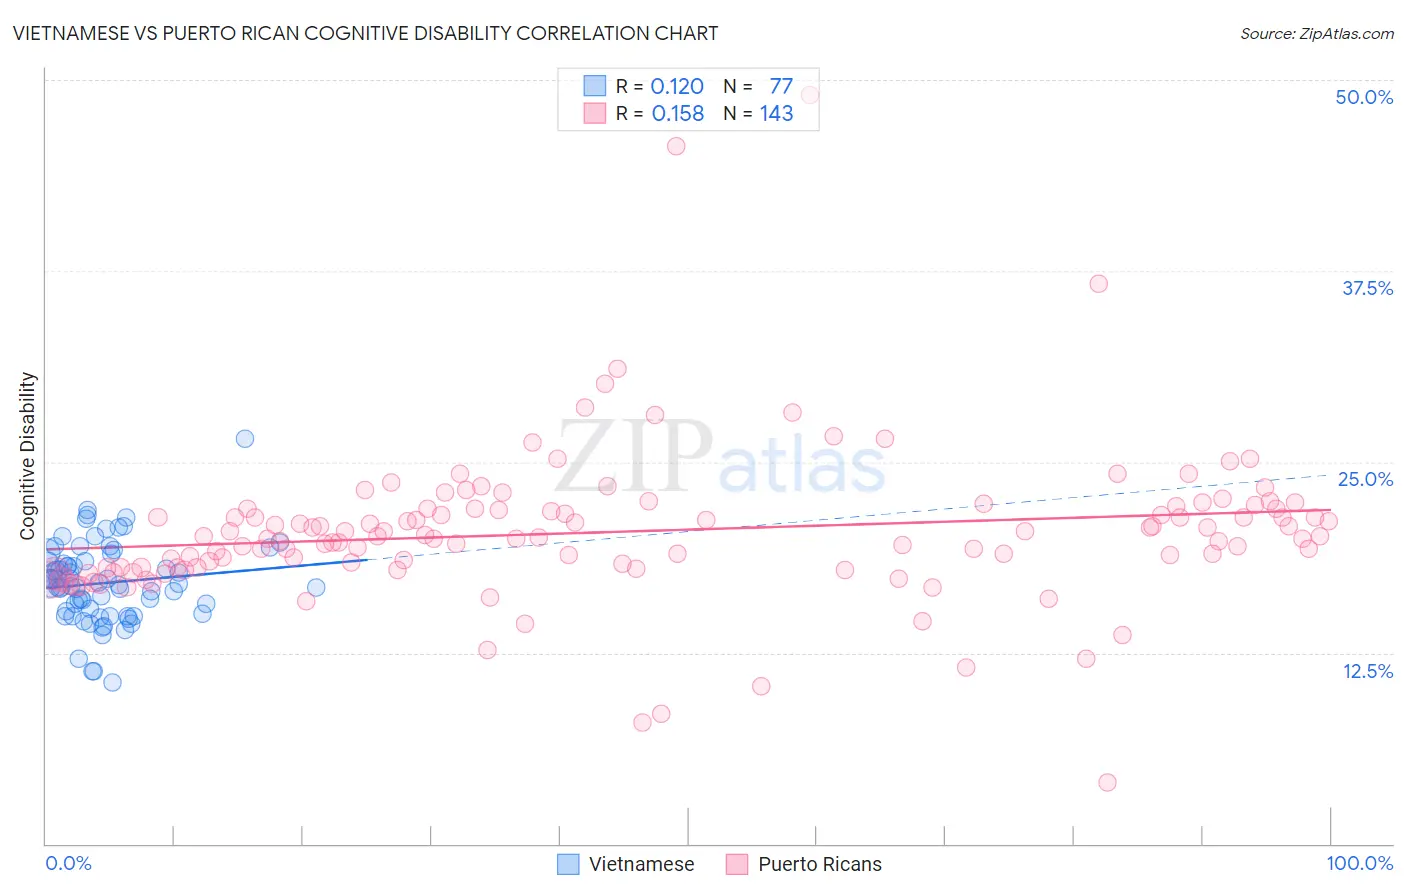
Vietnamese vs Puerto Rican Cognitive Disability Correlation Chart
The statistical analysis conducted on geographies consisting of 170,756,377 people shows a poor positive correlation between the proportion of Vietnamese and percentage of population with cognitive disability in the United States with a correlation coefficient (R) of 0.120 and weighted average of 17.7%. Similarly, the statistical analysis conducted on geographies consisting of 528,170,098 people shows a poor positive correlation between the proportion of Puerto Ricans and percentage of population with cognitive disability in the United States with a correlation coefficient (R) of 0.158 and weighted average of 19.2%, a difference of 8.6%.
Cognitive Disability Correlation Summary
| Measurement | Vietnamese | Puerto Rican |
| Minimum | 10.6% | 4.0% |
| Maximum | 26.5% | 49.0% |
| Range | 15.9% | 44.9% |
| Mean | 17.1% | 20.4% |
| Median | 16.9% | 20.1% |
| Interquartile 25% (IQ1) | 15.2% | 18.1% |
| Interquartile 75% (IQ3) | 18.5% | 21.9% |
| Interquartile Range (IQR) | 3.3% | 3.8% |
| Standard Deviation (Sample) | 2.6% | 5.2% |
| Standard Deviation (Population) | 2.6% | 5.1% |
Similar Demographics by Cognitive Disability
Demographics Similar to Vietnamese by Cognitive Disability
In terms of cognitive disability, the demographic groups most similar to Vietnamese are Fijian (17.7%, a difference of 0.010%), Marshallese (17.7%, a difference of 0.16%), Immigrants from St. Vincent and the Grenadines (17.7%, a difference of 0.19%), Alsatian (17.7%, a difference of 0.20%), and Central American (17.7%, a difference of 0.21%).
| Demographics | Rating | Rank | Cognitive Disability |
| Icelanders | 6.4 /100 | #218 | Tragic 17.6% |
| Immigrants | Sierra Leone | 6.3 /100 | #219 | Tragic 17.6% |
| Zimbabweans | 6.1 /100 | #220 | Tragic 17.6% |
| Moroccans | 5.9 /100 | #221 | Tragic 17.6% |
| Central Americans | 4.5 /100 | #222 | Tragic 17.7% |
| Alsatians | 4.5 /100 | #223 | Tragic 17.7% |
| Fijians | 3.4 /100 | #224 | Tragic 17.7% |
| Vietnamese | 3.4 /100 | #225 | Tragic 17.7% |
| Marshallese | 2.7 /100 | #226 | Tragic 17.7% |
| Immigrants | St. Vincent and the Grenadines | 2.6 /100 | #227 | Tragic 17.7% |
| Immigrants | Central America | 2.3 /100 | #228 | Tragic 17.7% |
| Immigrants | Guatemala | 2.2 /100 | #229 | Tragic 17.7% |
| Mongolians | 2.2 /100 | #230 | Tragic 17.7% |
| Guatemalans | 2.1 /100 | #231 | Tragic 17.8% |
| Tongans | 2.1 /100 | #232 | Tragic 17.8% |
Demographics Similar to Puerto Ricans by Cognitive Disability
In terms of cognitive disability, the demographic groups most similar to Puerto Ricans are Cape Verdean (19.2%, a difference of 0.020%), Tohono O'odham (19.3%, a difference of 0.26%), Houma (19.3%, a difference of 0.26%), Lumbee (19.1%, a difference of 0.47%), and Immigrants from Saudi Arabia (19.1%, a difference of 0.82%).
| Demographics | Rating | Rank | Cognitive Disability |
| Immigrants | Sudan | 0.0 /100 | #332 | Tragic 18.8% |
| Immigrants | Yemen | 0.0 /100 | #333 | Tragic 18.8% |
| Sudanese | 0.0 /100 | #334 | Tragic 18.9% |
| Senegalese | 0.0 /100 | #335 | Tragic 19.0% |
| Blacks/African Americans | 0.0 /100 | #336 | Tragic 19.0% |
| Immigrants | Saudi Arabia | 0.0 /100 | #337 | Tragic 19.1% |
| Lumbee | 0.0 /100 | #338 | Tragic 19.1% |
| Puerto Ricans | 0.0 /100 | #339 | Tragic 19.2% |
| Cape Verdeans | 0.0 /100 | #340 | Tragic 19.2% |
| Tohono O'odham | 0.0 /100 | #341 | Tragic 19.3% |
| Houma | 0.0 /100 | #342 | Tragic 19.3% |
| Immigrants | Zaire | 0.0 /100 | #343 | Tragic 19.4% |
| Immigrants | Congo | 0.0 /100 | #344 | Tragic 19.7% |
| Somalis | 0.0 /100 | #345 | Tragic 19.8% |
| Immigrants | Cabo Verde | 0.0 /100 | #346 | Tragic 19.9% |