Immigrants from West Indies vs Immigrants from Haiti No Vehicles in Household
COMPARE
Immigrants from West Indies
Immigrants from Haiti
No Vehicles in Household
No Vehicles in Household Comparison
Immigrants from West Indies
Immigrants from Haiti
20.5%
NO VEHICLES IN HOUSEHOLD
0.0/ 100
METRIC RATING
326th/ 347
METRIC RANK
15.4%
NO VEHICLES IN HOUSEHOLD
0.0/ 100
METRIC RATING
307th/ 347
METRIC RANK
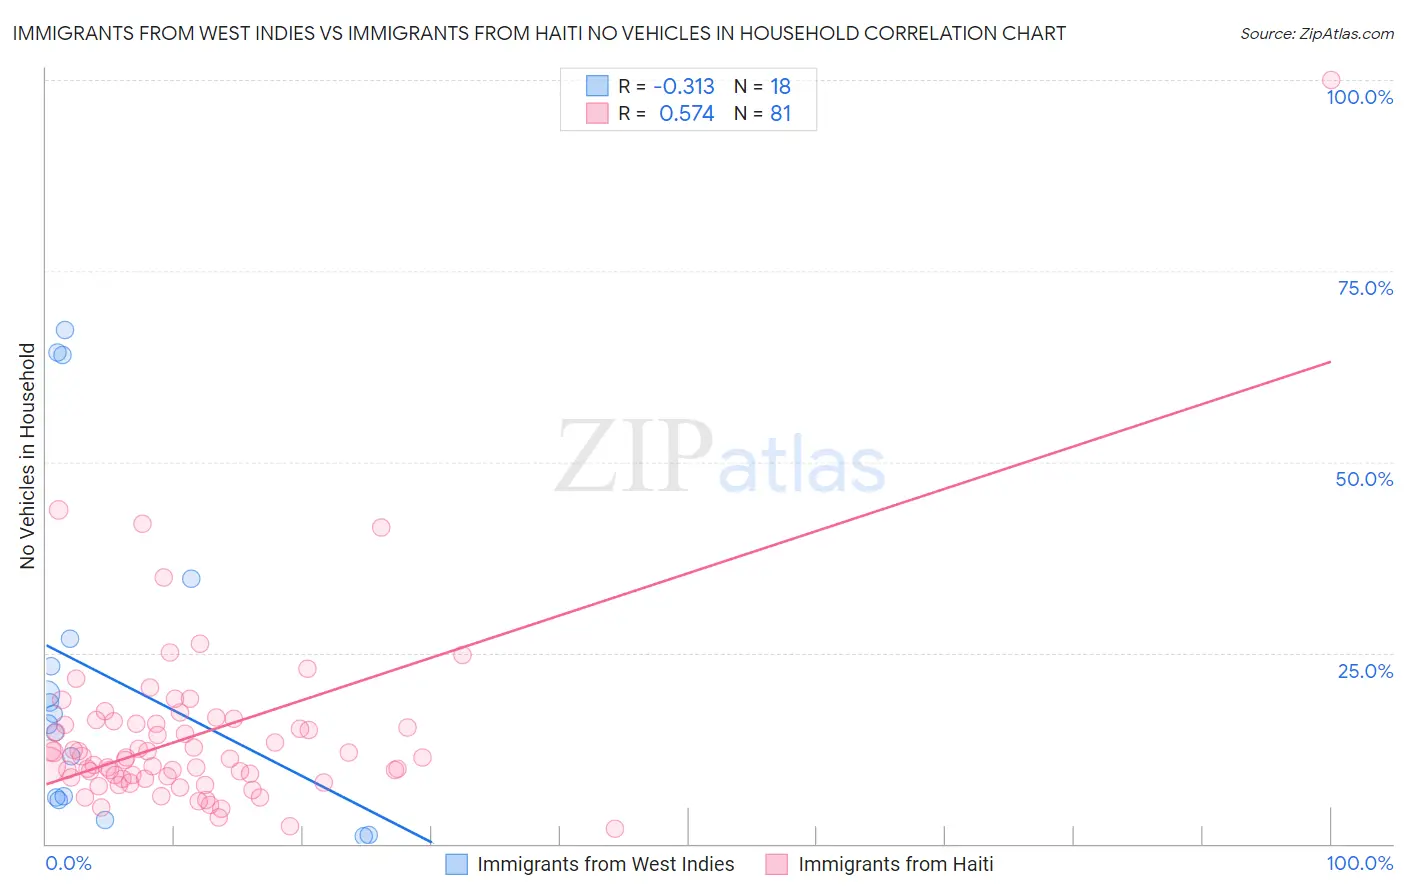
Immigrants from West Indies vs Immigrants from Haiti No Vehicles in Household Correlation Chart
The statistical analysis conducted on geographies consisting of 72,444,835 people shows a mild negative correlation between the proportion of Immigrants from West Indies and percentage of households with no vehicle available in the United States with a correlation coefficient (R) of -0.313 and weighted average of 20.5%. Similarly, the statistical analysis conducted on geographies consisting of 224,981,556 people shows a substantial positive correlation between the proportion of Immigrants from Haiti and percentage of households with no vehicle available in the United States with a correlation coefficient (R) of 0.574 and weighted average of 15.4%, a difference of 33.5%.
No Vehicles in Household Correlation Summary
| Measurement | Immigrants from West Indies | Immigrants from Haiti |
| Minimum | 1.0% | 2.0% |
| Maximum | 67.3% | 100.0% |
| Range | 66.3% | 98.0% |
| Mean | 22.2% | 14.3% |
| Median | 16.4% | 11.3% |
| Interquartile 25% (IQ1) | 6.0% | 8.6% |
| Interquartile 75% (IQ3) | 26.8% | 15.8% |
| Interquartile Range (IQR) | 20.8% | 7.2% |
| Standard Deviation (Sample) | 21.8% | 12.6% |
| Standard Deviation (Population) | 21.2% | 12.5% |
Demographics Similar to Immigrants from West Indies and Immigrants from Haiti by No Vehicles in Household
In terms of no vehicles in household, the demographic groups most similar to Immigrants from West Indies are Senegalese (19.8%, a difference of 3.9%), Immigrants from Caribbean (19.6%, a difference of 4.7%), Immigrants from Yemen (19.5%, a difference of 5.5%), Immigrants from Cabo Verde (18.4%, a difference of 11.3%), and Jamaican (17.9%, a difference of 14.5%). Similarly, the demographic groups most similar to Immigrants from Haiti are U.S. Virgin Islander (15.4%, a difference of 0.030%), Immigrants from Belize (15.4%, a difference of 0.13%), Puerto Rican (15.5%, a difference of 0.69%), Cape Verdean (15.6%, a difference of 1.3%), and Immigrants from Israel (15.6%, a difference of 1.3%).
| Demographics | Rating | Rank | No Vehicles in Household |
| Immigrants | Belize | 0.0 /100 | #306 | Tragic 15.4% |
| Immigrants | Haiti | 0.0 /100 | #307 | Tragic 15.4% |
| U.S. Virgin Islanders | 0.0 /100 | #308 | Tragic 15.4% |
| Puerto Ricans | 0.0 /100 | #309 | Tragic 15.5% |
| Cape Verdeans | 0.0 /100 | #310 | Tragic 15.6% |
| Immigrants | Israel | 0.0 /100 | #311 | Tragic 15.6% |
| Alaskan Athabascans | 0.0 /100 | #312 | Tragic 15.6% |
| Tohono O'odham | 0.0 /100 | #313 | Tragic 15.6% |
| Albanians | 0.0 /100 | #314 | Tragic 15.6% |
| Cypriots | 0.0 /100 | #315 | Tragic 15.7% |
| Ghanaians | 0.0 /100 | #316 | Tragic 16.4% |
| Immigrants | Ghana | 0.0 /100 | #317 | Tragic 16.6% |
| Immigrants | Belarus | 0.0 /100 | #318 | Tragic 16.7% |
| Alaska Natives | 0.0 /100 | #319 | Tragic 17.4% |
| Soviet Union | 0.0 /100 | #320 | Tragic 17.4% |
| Jamaicans | 0.0 /100 | #321 | Tragic 17.9% |
| Immigrants | Cabo Verde | 0.0 /100 | #322 | Tragic 18.4% |
| Immigrants | Yemen | 0.0 /100 | #323 | Tragic 19.5% |
| Immigrants | Caribbean | 0.0 /100 | #324 | Tragic 19.6% |
| Senegalese | 0.0 /100 | #325 | Tragic 19.8% |
| Immigrants | West Indies | 0.0 /100 | #326 | Tragic 20.5% |