Thai vs Bahamian 1 or more Vehicles in Household
COMPARE
Thai
Bahamian
1 or more Vehicles in Household
1 or more Vehicles in Household Comparison
Thais
Bahamians
91.9%
1 OR MORE VEHICLES IN HOUSEHOLD
99.8/ 100
METRIC RATING
62nd/ 347
METRIC RANK
90.2%
1 OR MORE VEHICLES IN HOUSEHOLD
80.5/ 100
METRIC RATING
146th/ 347
METRIC RANK
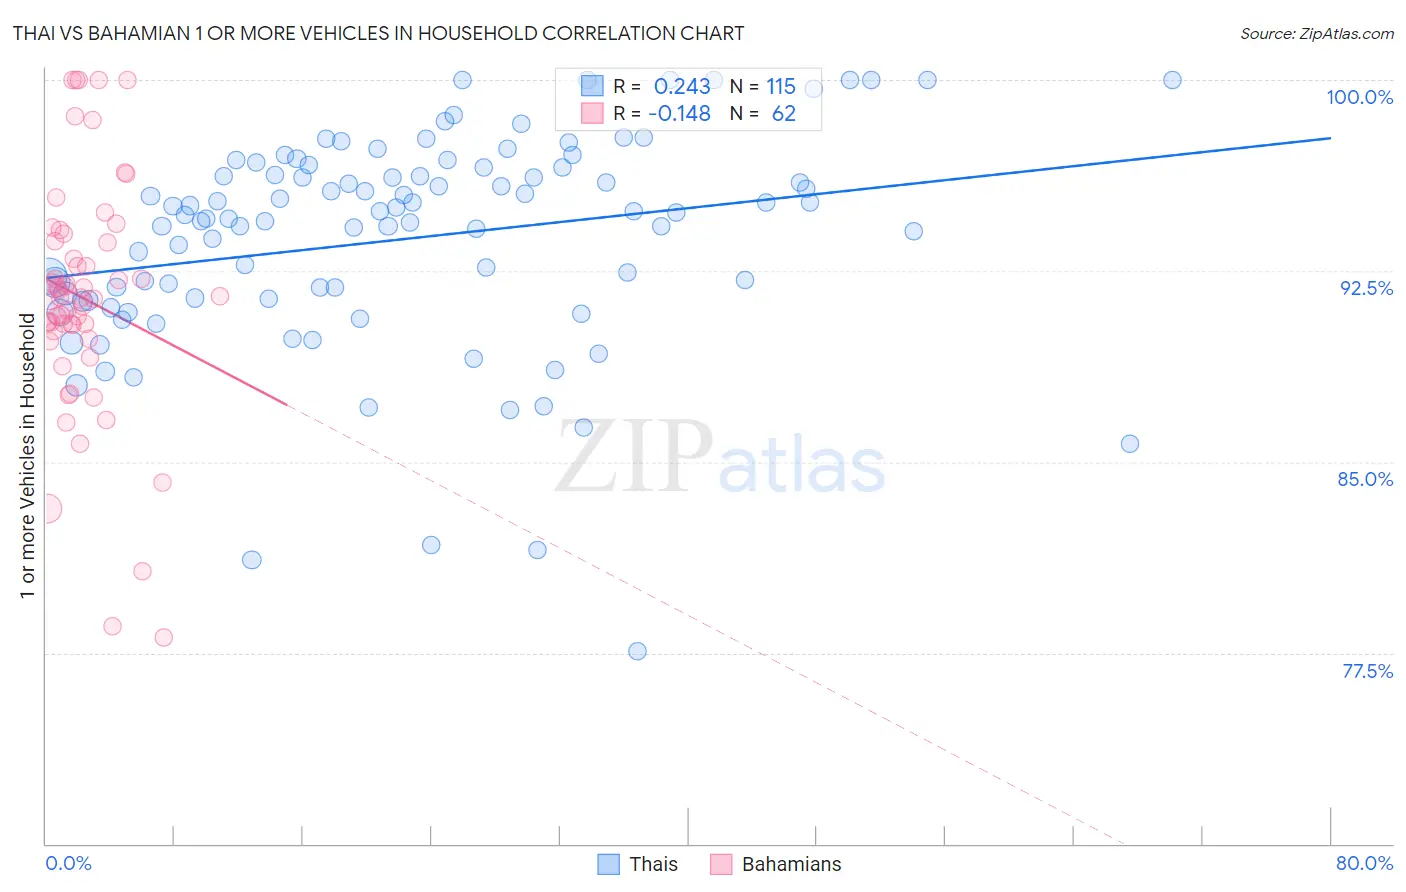
Thai vs Bahamian 1 or more Vehicles in Household Correlation Chart
The statistical analysis conducted on geographies consisting of 456,543,846 people shows a weak positive correlation between the proportion of Thais and percentage of households with 1 or more vehicles available in the United States with a correlation coefficient (R) of 0.243 and weighted average of 91.9%. Similarly, the statistical analysis conducted on geographies consisting of 112,631,692 people shows a poor negative correlation between the proportion of Bahamians and percentage of households with 1 or more vehicles available in the United States with a correlation coefficient (R) of -0.148 and weighted average of 90.2%, a difference of 1.9%.
1 or more Vehicles in Household Correlation Summary
| Measurement | Thai | Bahamian |
| Minimum | 77.6% | 78.1% |
| Maximum | 100.0% | 100.0% |
| Range | 22.4% | 21.9% |
| Mean | 93.8% | 91.4% |
| Median | 94.7% | 91.5% |
| Interquartile 25% (IQ1) | 91.4% | 90.1% |
| Interquartile 75% (IQ3) | 96.6% | 93.7% |
| Interquartile Range (IQR) | 5.1% | 3.6% |
| Standard Deviation (Sample) | 4.2% | 4.7% |
| Standard Deviation (Population) | 4.2% | 4.6% |
Similar Demographics by 1 or more Vehicles in Household
Demographics Similar to Thais by 1 or more Vehicles in Household
In terms of 1 or more vehicles in household, the demographic groups most similar to Thais are Immigrants from India (91.9%, a difference of 0.0%), Slovak (91.9%, a difference of 0.020%), Chinese (91.9%, a difference of 0.020%), Croatian (91.9%, a difference of 0.030%), and Venezuelan (91.9%, a difference of 0.040%).
| Demographics | Rating | Rank | 1 or more Vehicles in Household |
| Immigrants | Afghanistan | 99.9 /100 | #55 | Exceptional 92.0% |
| Immigrants | Venezuela | 99.9 /100 | #56 | Exceptional 92.0% |
| Iraqis | 99.8 /100 | #57 | Exceptional 91.9% |
| Immigrants | Mexico | 99.8 /100 | #58 | Exceptional 91.9% |
| Venezuelans | 99.8 /100 | #59 | Exceptional 91.9% |
| Slovaks | 99.8 /100 | #60 | Exceptional 91.9% |
| Immigrants | India | 99.8 /100 | #61 | Exceptional 91.9% |
| Thais | 99.8 /100 | #62 | Exceptional 91.9% |
| Chinese | 99.8 /100 | #63 | Exceptional 91.9% |
| Croatians | 99.8 /100 | #64 | Exceptional 91.9% |
| Immigrants | Laos | 99.8 /100 | #65 | Exceptional 91.8% |
| Canadians | 99.8 /100 | #66 | Exceptional 91.8% |
| Spaniards | 99.8 /100 | #67 | Exceptional 91.8% |
| Immigrants | Scotland | 99.7 /100 | #68 | Exceptional 91.8% |
| Palestinians | 99.7 /100 | #69 | Exceptional 91.7% |
Demographics Similar to Bahamians by 1 or more Vehicles in Household
In terms of 1 or more vehicles in household, the demographic groups most similar to Bahamians are Immigrants from Zimbabwe (90.2%, a difference of 0.020%), Sioux (90.2%, a difference of 0.020%), Chilean (90.2%, a difference of 0.020%), Immigrants from Bahamas (90.2%, a difference of 0.030%), and Immigrants from Eastern Africa (90.1%, a difference of 0.050%).
| Demographics | Rating | Rank | 1 or more Vehicles in Household |
| Estonians | 85.6 /100 | #139 | Excellent 90.3% |
| Sudanese | 85.2 /100 | #140 | Excellent 90.3% |
| Immigrants | Moldova | 83.1 /100 | #141 | Excellent 90.2% |
| Immigrants | Lithuania | 83.0 /100 | #142 | Excellent 90.2% |
| Immigrants | Bahamas | 81.5 /100 | #143 | Excellent 90.2% |
| Immigrants | Zimbabwe | 81.5 /100 | #144 | Excellent 90.2% |
| Sioux | 81.3 /100 | #145 | Excellent 90.2% |
| Bahamians | 80.5 /100 | #146 | Excellent 90.2% |
| Chileans | 79.8 /100 | #147 | Good 90.2% |
| Immigrants | Eastern Africa | 78.2 /100 | #148 | Good 90.1% |
| Immigrants | Nicaragua | 76.7 /100 | #149 | Good 90.1% |
| Immigrants | Micronesia | 75.9 /100 | #150 | Good 90.1% |
| Immigrants | Bosnia and Herzegovina | 75.4 /100 | #151 | Good 90.1% |
| Tlingit-Haida | 74.3 /100 | #152 | Good 90.1% |
| New Zealanders | 73.8 /100 | #153 | Good 90.1% |