Sudanese vs Immigrants from Laos No Vehicles in Household
COMPARE
Sudanese
Immigrants from Laos
No Vehicles in Household
No Vehicles in Household Comparison
Sudanese
Immigrants from Laos
9.8%
NO VEHICLES IN HOUSEHOLD
83.1/ 100
METRIC RATING
141st/ 347
METRIC RANK
8.2%
NO VEHICLES IN HOUSEHOLD
99.8/ 100
METRIC RATING
60th/ 347
METRIC RANK
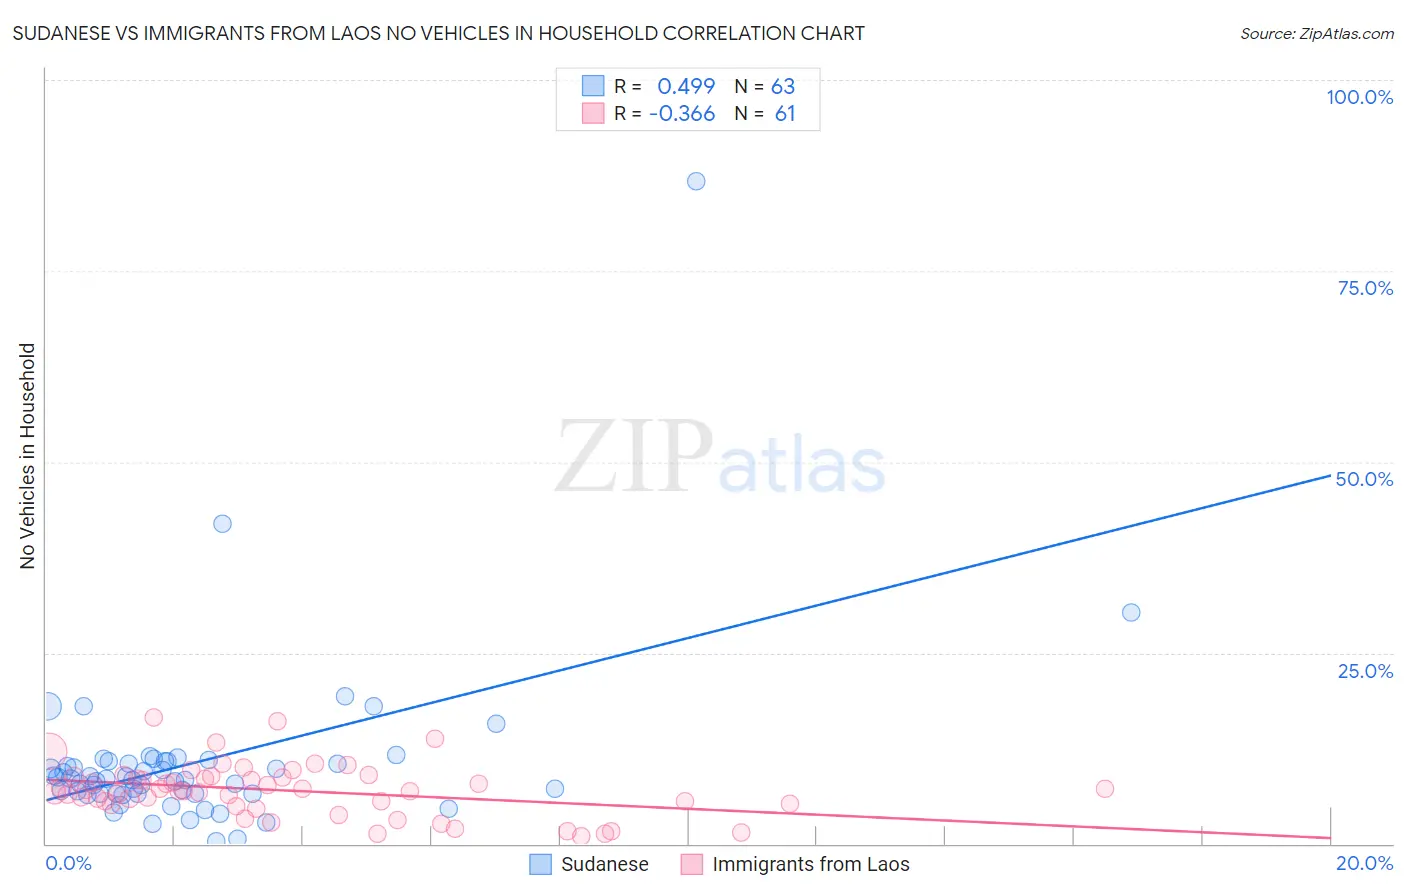
Sudanese vs Immigrants from Laos No Vehicles in Household Correlation Chart
The statistical analysis conducted on geographies consisting of 110,072,180 people shows a moderate positive correlation between the proportion of Sudanese and percentage of households with no vehicle available in the United States with a correlation coefficient (R) of 0.499 and weighted average of 9.8%. Similarly, the statistical analysis conducted on geographies consisting of 201,284,656 people shows a mild negative correlation between the proportion of Immigrants from Laos and percentage of households with no vehicle available in the United States with a correlation coefficient (R) of -0.366 and weighted average of 8.2%, a difference of 20.5%.
No Vehicles in Household Correlation Summary
| Measurement | Sudanese | Immigrants from Laos |
| Minimum | 0.33% | 0.99% |
| Maximum | 86.7% | 16.5% |
| Range | 86.3% | 15.5% |
| Mean | 10.6% | 7.0% |
| Median | 8.4% | 6.9% |
| Interquartile 25% (IQ1) | 6.6% | 5.2% |
| Interquartile 75% (IQ3) | 10.8% | 8.7% |
| Interquartile Range (IQR) | 4.2% | 3.5% |
| Standard Deviation (Sample) | 11.6% | 3.4% |
| Standard Deviation (Population) | 11.5% | 3.4% |
Similar Demographics by No Vehicles in Household
Demographics Similar to Sudanese by No Vehicles in Household
In terms of no vehicles in household, the demographic groups most similar to Sudanese are Immigrants from Zimbabwe (9.9%, a difference of 0.13%), Immigrants from Lithuania (9.8%, a difference of 0.22%), Marshallese (9.8%, a difference of 0.23%), Estonian (9.8%, a difference of 0.27%), and Immigrants from Moldova (9.8%, a difference of 0.39%).
| Demographics | Rating | Rank | No Vehicles in Household |
| Syrians | 87.1 /100 | #134 | Excellent 9.7% |
| Latvians | 85.1 /100 | #135 | Excellent 9.8% |
| Immigrants | South Africa | 85.0 /100 | #136 | Excellent 9.8% |
| Immigrants | Moldova | 84.6 /100 | #137 | Excellent 9.8% |
| Estonians | 84.2 /100 | #138 | Excellent 9.8% |
| Marshallese | 84.0 /100 | #139 | Excellent 9.8% |
| Immigrants | Lithuania | 84.0 /100 | #140 | Excellent 9.8% |
| Sudanese | 83.1 /100 | #141 | Excellent 9.8% |
| Immigrants | Zimbabwe | 82.6 /100 | #142 | Excellent 9.9% |
| Chileans | 81.2 /100 | #143 | Excellent 9.9% |
| Immigrants | Bahamas | 81.2 /100 | #144 | Excellent 9.9% |
| Bahamians | 81.0 /100 | #145 | Excellent 9.9% |
| Hungarians | 80.0 /100 | #146 | Excellent 9.9% |
| Immigrants | Nicaragua | 79.8 /100 | #147 | Good 9.9% |
| Immigrants | Bosnia and Herzegovina | 79.1 /100 | #148 | Good 9.9% |
Demographics Similar to Immigrants from Laos by No Vehicles in Household
In terms of no vehicles in household, the demographic groups most similar to Immigrants from Laos are Immigrants from India (8.2%, a difference of 0.070%), Thai (8.2%, a difference of 0.17%), Immigrants from Mexico (8.1%, a difference of 0.42%), Venezuelan (8.1%, a difference of 0.53%), and Chinese (8.2%, a difference of 0.62%).
| Demographics | Rating | Rank | No Vehicles in Household |
| Slovenes | 99.9 /100 | #53 | Exceptional 8.0% |
| Immigrants | Venezuela | 99.9 /100 | #54 | Exceptional 8.1% |
| Celtics | 99.9 /100 | #55 | Exceptional 8.1% |
| Immigrants | Afghanistan | 99.9 /100 | #56 | Exceptional 8.1% |
| Venezuelans | 99.8 /100 | #57 | Exceptional 8.1% |
| Immigrants | Mexico | 99.8 /100 | #58 | Exceptional 8.1% |
| Immigrants | India | 99.8 /100 | #59 | Exceptional 8.2% |
| Immigrants | Laos | 99.8 /100 | #60 | Exceptional 8.2% |
| Thais | 99.8 /100 | #61 | Exceptional 8.2% |
| Chinese | 99.8 /100 | #62 | Exceptional 8.2% |
| Slovaks | 99.8 /100 | #63 | Exceptional 8.3% |
| Croatians | 99.8 /100 | #64 | Exceptional 8.3% |
| Canadians | 99.7 /100 | #65 | Exceptional 8.3% |
| Palestinians | 99.7 /100 | #66 | Exceptional 8.3% |
| Immigrants | Scotland | 99.7 /100 | #67 | Exceptional 8.3% |