Sudanese vs Syrian No Vehicles in Household
COMPARE
Sudanese
Syrian
No Vehicles in Household
No Vehicles in Household Comparison
Sudanese
Syrians
9.8%
NO VEHICLES IN HOUSEHOLD
83.1/ 100
METRIC RATING
141st/ 347
METRIC RANK
9.7%
NO VEHICLES IN HOUSEHOLD
87.1/ 100
METRIC RATING
134th/ 347
METRIC RANK
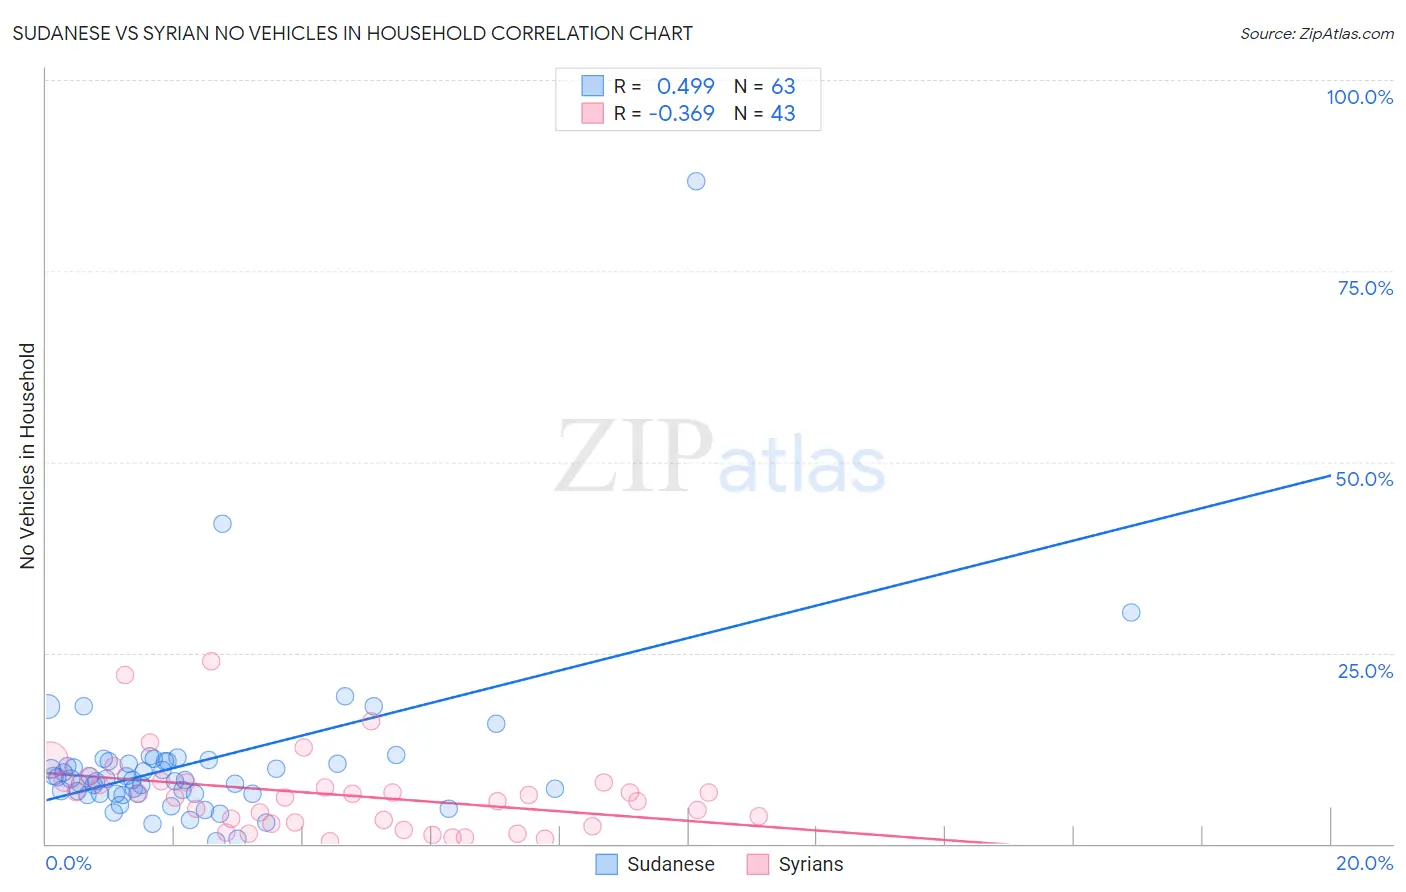
Sudanese vs Syrian No Vehicles in Household Correlation Chart
The statistical analysis conducted on geographies consisting of 110,072,180 people shows a moderate positive correlation between the proportion of Sudanese and percentage of households with no vehicle available in the United States with a correlation coefficient (R) of 0.499 and weighted average of 9.8%. Similarly, the statistical analysis conducted on geographies consisting of 265,903,344 people shows a mild negative correlation between the proportion of Syrians and percentage of households with no vehicle available in the United States with a correlation coefficient (R) of -0.369 and weighted average of 9.7%, a difference of 1.1%.
No Vehicles in Household Correlation Summary
| Measurement | Sudanese | Syrian |
| Minimum | 0.33% | 0.29% |
| Maximum | 86.7% | 23.8% |
| Range | 86.3% | 23.5% |
| Mean | 10.6% | 6.4% |
| Median | 8.4% | 6.1% |
| Interquartile 25% (IQ1) | 6.6% | 2.6% |
| Interquartile 75% (IQ3) | 10.8% | 8.0% |
| Interquartile Range (IQR) | 4.2% | 5.4% |
| Standard Deviation (Sample) | 11.6% | 5.2% |
| Standard Deviation (Population) | 11.5% | 5.1% |
Demographics Similar to Sudanese and Syrians by No Vehicles in Household
In terms of no vehicles in household, the demographic groups most similar to Sudanese are Immigrants from Zimbabwe (9.9%, a difference of 0.13%), Immigrants from Lithuania (9.8%, a difference of 0.22%), Marshallese (9.8%, a difference of 0.23%), Estonian (9.8%, a difference of 0.27%), and Immigrants from Moldova (9.8%, a difference of 0.39%). Similarly, the demographic groups most similar to Syrians are Immigrants from Oceania (9.7%, a difference of 0.020%), Kenyan (9.7%, a difference of 0.32%), Immigrants from the Azores (9.7%, a difference of 0.39%), Latvian (9.8%, a difference of 0.58%), and Burmese (9.7%, a difference of 0.60%).
| Demographics | Rating | Rank | No Vehicles in Household |
| Immigrants | Kenya | 89.7 /100 | #127 | Excellent 9.6% |
| Immigrants | Syria | 89.5 /100 | #128 | Excellent 9.6% |
| Nicaraguans | 89.5 /100 | #129 | Excellent 9.7% |
| Burmese | 88.8 /100 | #130 | Excellent 9.7% |
| Immigrants | Azores | 88.2 /100 | #131 | Excellent 9.7% |
| Kenyans | 88.0 /100 | #132 | Excellent 9.7% |
| Immigrants | Oceania | 87.1 /100 | #133 | Excellent 9.7% |
| Syrians | 87.1 /100 | #134 | Excellent 9.7% |
| Latvians | 85.1 /100 | #135 | Excellent 9.8% |
| Immigrants | South Africa | 85.0 /100 | #136 | Excellent 9.8% |
| Immigrants | Moldova | 84.6 /100 | #137 | Excellent 9.8% |
| Estonians | 84.2 /100 | #138 | Excellent 9.8% |
| Marshallese | 84.0 /100 | #139 | Excellent 9.8% |
| Immigrants | Lithuania | 84.0 /100 | #140 | Excellent 9.8% |
| Sudanese | 83.1 /100 | #141 | Excellent 9.8% |
| Immigrants | Zimbabwe | 82.6 /100 | #142 | Excellent 9.9% |
| Chileans | 81.2 /100 | #143 | Excellent 9.9% |
| Immigrants | Bahamas | 81.2 /100 | #144 | Excellent 9.9% |
| Bahamians | 81.0 /100 | #145 | Excellent 9.9% |
| Hungarians | 80.0 /100 | #146 | Excellent 9.9% |
| Immigrants | Nicaragua | 79.8 /100 | #147 | Good 9.9% |