Sudanese vs Immigrants from Laos Unemployment Among Women with Children Under 6 years
COMPARE
Sudanese
Immigrants from Laos
Unemployment Among Women with Children Under 6 years
Unemployment Among Women with Children Under 6 years Comparison
Sudanese
Immigrants from Laos
7.8%
UNEMPLOYMENT AMONG WOMEN WITH CHILDREN UNDER 6 YEARS
23.5/ 100
METRIC RATING
202nd/ 347
METRIC RANK
7.6%
UNEMPLOYMENT AMONG WOMEN WITH CHILDREN UNDER 6 YEARS
50.0/ 100
METRIC RATING
174th/ 347
METRIC RANK
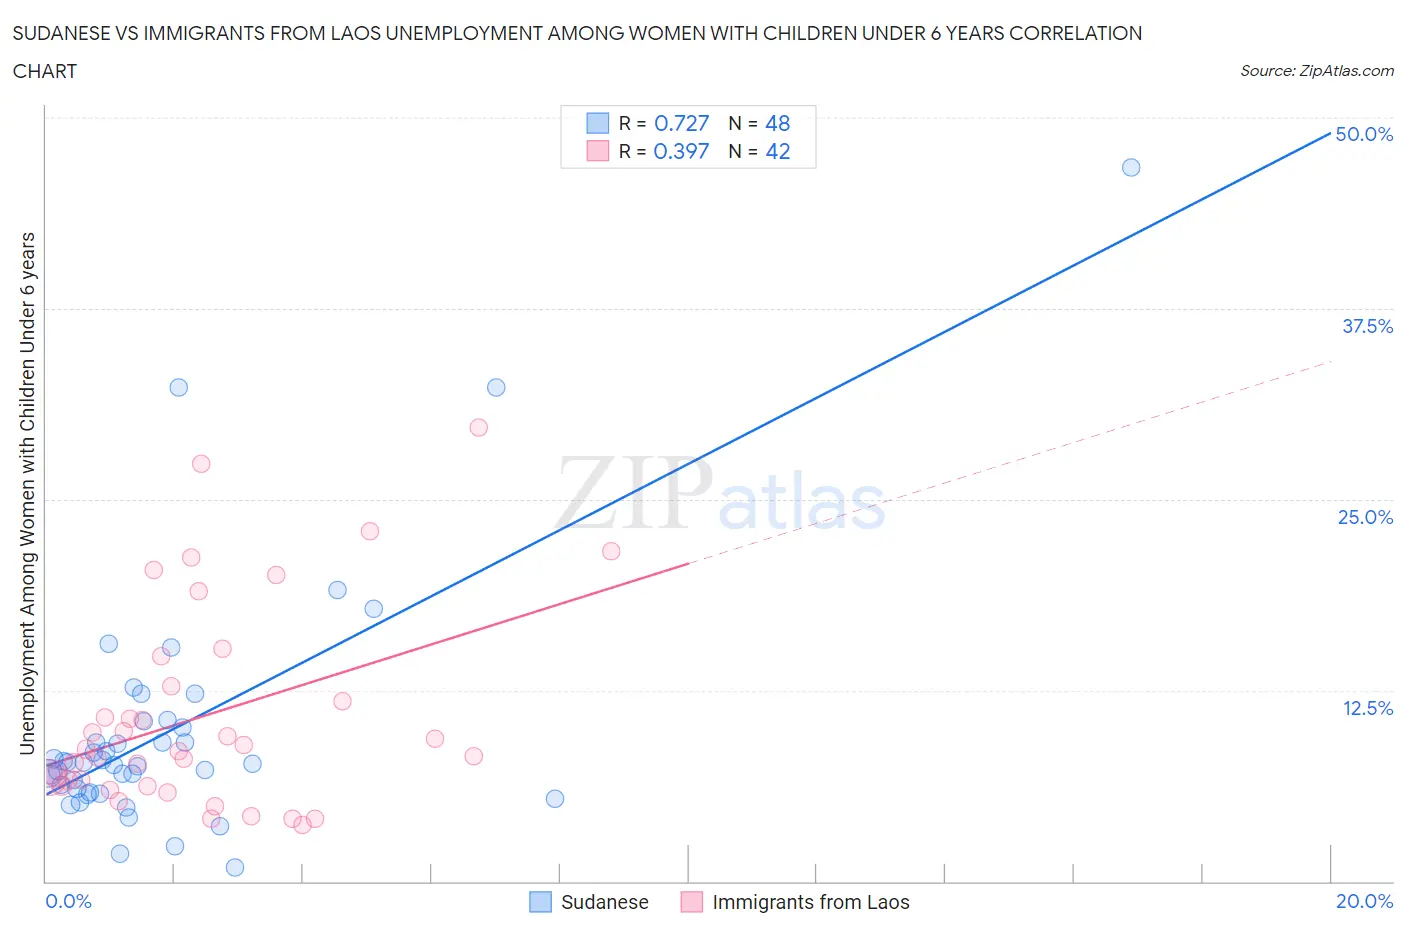
Sudanese vs Immigrants from Laos Unemployment Among Women with Children Under 6 years Correlation Chart
The statistical analysis conducted on geographies consisting of 100,483,224 people shows a strong positive correlation between the proportion of Sudanese and unemployment rate among women with children under the age of 6 in the United States with a correlation coefficient (R) of 0.727 and weighted average of 7.8%. Similarly, the statistical analysis conducted on geographies consisting of 170,684,767 people shows a mild positive correlation between the proportion of Immigrants from Laos and unemployment rate among women with children under the age of 6 in the United States with a correlation coefficient (R) of 0.397 and weighted average of 7.6%, a difference of 2.0%.
Unemployment Among Women with Children Under 6 years Correlation Summary
| Measurement | Sudanese | Immigrants from Laos |
| Minimum | 0.90% | 3.7% |
| Maximum | 46.7% | 29.7% |
| Range | 45.8% | 26.0% |
| Mean | 9.9% | 10.8% |
| Median | 7.7% | 8.6% |
| Interquartile 25% (IQ1) | 6.0% | 6.3% |
| Interquartile 75% (IQ3) | 10.3% | 12.8% |
| Interquartile Range (IQR) | 4.3% | 6.5% |
| Standard Deviation (Sample) | 8.2% | 6.6% |
| Standard Deviation (Population) | 8.1% | 6.5% |
Similar Demographics by Unemployment Among Women with Children Under 6 years
Demographics Similar to Sudanese by Unemployment Among Women with Children Under 6 years
In terms of unemployment among women with children under 6 years, the demographic groups most similar to Sudanese are Spaniard (7.8%, a difference of 0.010%), Basque (7.8%, a difference of 0.11%), Lebanese (7.8%, a difference of 0.12%), Guamanian/Chamorro (7.8%, a difference of 0.18%), and Immigrants (7.8%, a difference of 0.20%).
| Demographics | Rating | Rank | Unemployment Among Women with Children Under 6 years |
| Malaysians | 31.1 /100 | #195 | Fair 7.7% |
| Immigrants | St. Vincent and the Grenadines | 31.1 /100 | #196 | Fair 7.7% |
| Italians | 30.4 /100 | #197 | Fair 7.7% |
| Lithuanians | 30.0 /100 | #198 | Fair 7.8% |
| Immigrants | Poland | 27.3 /100 | #199 | Fair 7.8% |
| Guamanians/Chamorros | 25.5 /100 | #200 | Fair 7.8% |
| Basques | 24.7 /100 | #201 | Fair 7.8% |
| Sudanese | 23.5 /100 | #202 | Fair 7.8% |
| Spaniards | 23.3 /100 | #203 | Fair 7.8% |
| Lebanese | 22.2 /100 | #204 | Fair 7.8% |
| Immigrants | Immigrants | 21.4 /100 | #205 | Fair 7.8% |
| Hungarians | 21.2 /100 | #206 | Fair 7.8% |
| Canadians | 20.6 /100 | #207 | Fair 7.8% |
| Immigrants | Syria | 18.9 /100 | #208 | Poor 7.8% |
| Costa Ricans | 17.6 /100 | #209 | Poor 7.8% |
Demographics Similar to Immigrants from Laos by Unemployment Among Women with Children Under 6 years
In terms of unemployment among women with children under 6 years, the demographic groups most similar to Immigrants from Laos are Panamanian (7.6%, a difference of 0.020%), Cree (7.6%, a difference of 0.11%), Puget Sound Salish (7.7%, a difference of 0.15%), Austrian (7.7%, a difference of 0.27%), and Immigrants from England (7.7%, a difference of 0.31%).
| Demographics | Rating | Rank | Unemployment Among Women with Children Under 6 years |
| Kenyans | 62.5 /100 | #167 | Good 7.6% |
| Immigrants | Canada | 61.6 /100 | #168 | Good 7.6% |
| Immigrants | Scotland | 61.3 /100 | #169 | Good 7.6% |
| Czechs | 59.8 /100 | #170 | Average 7.6% |
| Immigrants | Grenada | 59.0 /100 | #171 | Average 7.6% |
| Immigrants | North America | 57.7 /100 | #172 | Average 7.6% |
| Cree | 51.6 /100 | #173 | Average 7.6% |
| Immigrants | Laos | 50.0 /100 | #174 | Average 7.6% |
| Panamanians | 49.6 /100 | #175 | Average 7.6% |
| Puget Sound Salish | 47.7 /100 | #176 | Average 7.7% |
| Austrians | 46.0 /100 | #177 | Average 7.7% |
| Immigrants | England | 45.4 /100 | #178 | Average 7.7% |
| Immigrants | Western Europe | 44.9 /100 | #179 | Average 7.7% |
| Immigrants | Uruguay | 44.5 /100 | #180 | Average 7.7% |
| Brazilians | 43.9 /100 | #181 | Average 7.7% |