Subsaharan African vs Pueblo 4 or more Vehicles in Household
COMPARE
Subsaharan African
Pueblo
4 or more Vehicles in Household
4 or more Vehicles in Household Comparison
Sub-Saharan Africans
Pueblo
5.7%
4 OR MORE VEHICLES IN HOUSEHOLD
2.1/ 100
METRIC RATING
252nd/ 347
METRIC RANK
8.6%
4 OR MORE VEHICLES IN HOUSEHOLD
100.0/ 100
METRIC RATING
20th/ 347
METRIC RANK
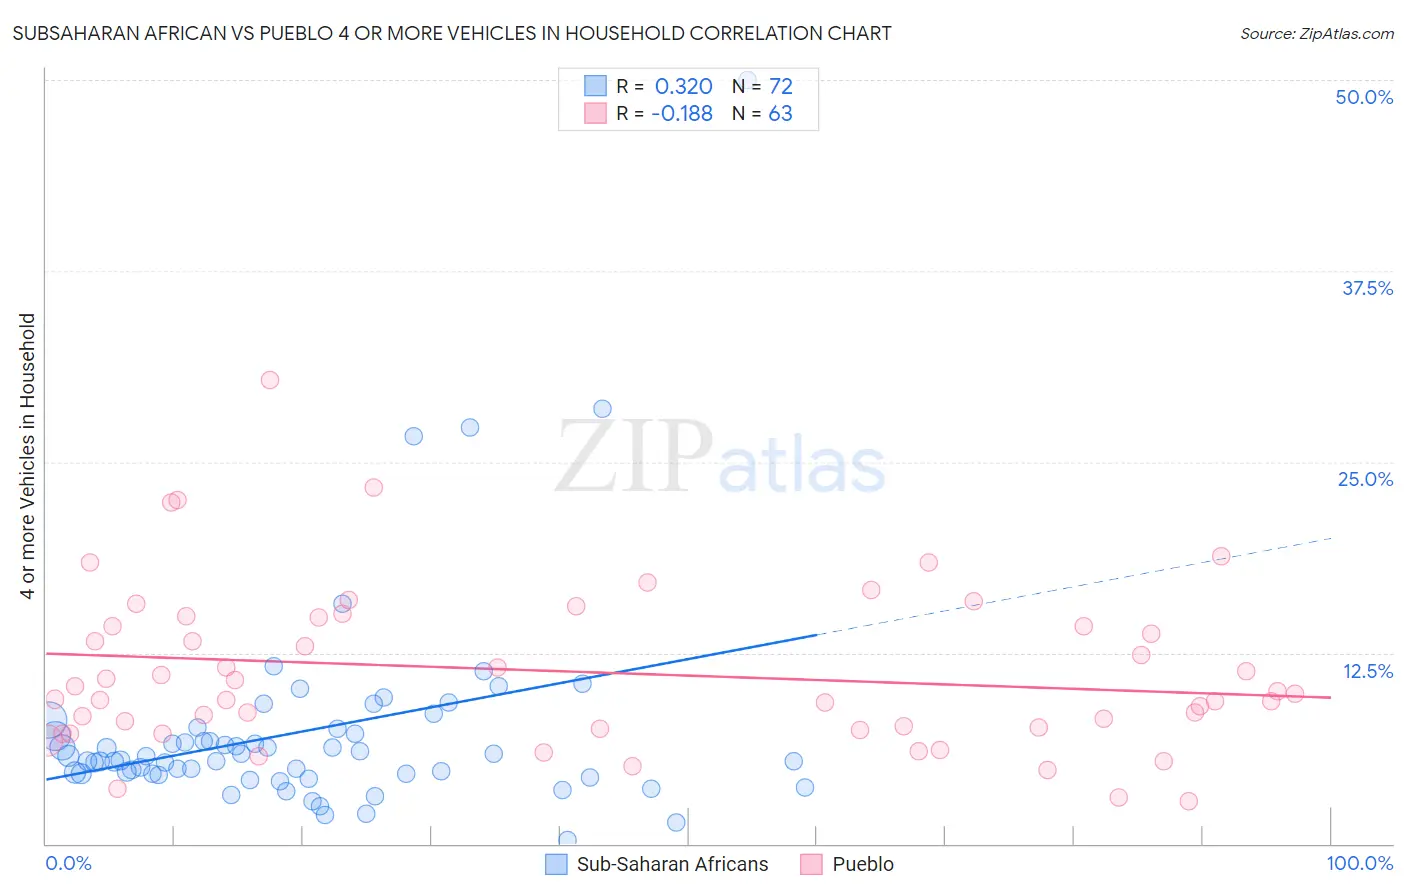
Subsaharan African vs Pueblo 4 or more Vehicles in Household Correlation Chart
The statistical analysis conducted on geographies consisting of 505,333,507 people shows a mild positive correlation between the proportion of Sub-Saharan Africans and percentage of households with 4 or more vehicles available in the United States with a correlation coefficient (R) of 0.320 and weighted average of 5.7%. Similarly, the statistical analysis conducted on geographies consisting of 119,746,372 people shows a poor negative correlation between the proportion of Pueblo and percentage of households with 4 or more vehicles available in the United States with a correlation coefficient (R) of -0.188 and weighted average of 8.6%, a difference of 50.2%.
4 or more Vehicles in Household Correlation Summary
| Measurement | Subsaharan African | Pueblo |
| Minimum | 0.25% | 2.8% |
| Maximum | 50.0% | 30.3% |
| Range | 49.8% | 27.5% |
| Mean | 7.4% | 11.3% |
| Median | 5.6% | 9.8% |
| Interquartile 25% (IQ1) | 4.6% | 7.5% |
| Interquartile 75% (IQ3) | 7.4% | 14.8% |
| Interquartile Range (IQR) | 2.8% | 7.3% |
| Standard Deviation (Sample) | 7.2% | 5.3% |
| Standard Deviation (Population) | 7.1% | 5.3% |
Similar Demographics by 4 or more Vehicles in Household
Demographics Similar to Sub-Saharan Africans by 4 or more Vehicles in Household
In terms of 4 or more vehicles in household, the demographic groups most similar to Sub-Saharan Africans are Ugandan (5.7%, a difference of 0.23%), Immigrants from Europe (5.7%, a difference of 0.25%), Immigrants from Southern Europe (5.7%, a difference of 0.35%), Immigrants from Eastern Africa (5.7%, a difference of 0.37%), and Immigrants from Ethiopia (5.7%, a difference of 0.48%).
| Demographics | Rating | Rank | 4 or more Vehicles in Household |
| Bulgarians | 3.1 /100 | #245 | Tragic 5.8% |
| Immigrants | North Macedonia | 2.5 /100 | #246 | Tragic 5.7% |
| Immigrants | Ethiopia | 2.4 /100 | #247 | Tragic 5.7% |
| Immigrants | Eastern Africa | 2.4 /100 | #248 | Tragic 5.7% |
| Immigrants | Southern Europe | 2.3 /100 | #249 | Tragic 5.7% |
| Immigrants | Europe | 2.3 /100 | #250 | Tragic 5.7% |
| Ugandans | 2.2 /100 | #251 | Tragic 5.7% |
| Sub-Saharan Africans | 2.1 /100 | #252 | Tragic 5.7% |
| Immigrants | Cuba | 1.6 /100 | #253 | Tragic 5.7% |
| Immigrants | Panama | 1.5 /100 | #254 | Tragic 5.7% |
| Yup'ik | 1.5 /100 | #255 | Tragic 5.7% |
| Immigrants | Turkey | 1.5 /100 | #256 | Tragic 5.7% |
| Immigrants | Northern Africa | 1.4 /100 | #257 | Tragic 5.6% |
| Immigrants | Lithuania | 1.4 /100 | #258 | Tragic 5.6% |
| Immigrants | France | 1.3 /100 | #259 | Tragic 5.6% |
Demographics Similar to Pueblo by 4 or more Vehicles in Household
In terms of 4 or more vehicles in household, the demographic groups most similar to Pueblo are Danish (8.6%, a difference of 0.050%), Immigrants from Vietnam (8.6%, a difference of 0.10%), Immigrants from Philippines (8.5%, a difference of 0.31%), Korean (8.6%, a difference of 0.82%), and Immigrants from Central America (8.5%, a difference of 1.1%).
| Demographics | Rating | Rank | 4 or more Vehicles in Household |
| Hawaiians | 100.0 /100 | #13 | Exceptional 8.9% |
| Chinese | 100.0 /100 | #14 | Exceptional 8.8% |
| Shoshone | 100.0 /100 | #15 | Exceptional 8.8% |
| Lumbee | 100.0 /100 | #16 | Exceptional 8.8% |
| Ute | 100.0 /100 | #17 | Exceptional 8.8% |
| Nepalese | 100.0 /100 | #18 | Exceptional 8.7% |
| Koreans | 100.0 /100 | #19 | Exceptional 8.6% |
| Pueblo | 100.0 /100 | #20 | Exceptional 8.6% |
| Danes | 100.0 /100 | #21 | Exceptional 8.6% |
| Immigrants | Vietnam | 100.0 /100 | #22 | Exceptional 8.6% |
| Immigrants | Philippines | 100.0 /100 | #23 | Exceptional 8.5% |
| Immigrants | Central America | 100.0 /100 | #24 | Exceptional 8.5% |
| Basques | 100.0 /100 | #25 | Exceptional 8.4% |
| Mexican American Indians | 100.0 /100 | #26 | Exceptional 8.4% |
| Sri Lankans | 100.0 /100 | #27 | Exceptional 8.4% |