Senegalese vs Argentinean 4 or more Vehicles in Household
COMPARE
Senegalese
Argentinean
4 or more Vehicles in Household
4 or more Vehicles in Household Comparison
Senegalese
Argentineans
4.3%
4 OR MORE VEHICLES IN HOUSEHOLD
0.0/ 100
METRIC RATING
327th/ 347
METRIC RANK
6.2%
4 OR MORE VEHICLES IN HOUSEHOLD
27.0/ 100
METRIC RATING
195th/ 347
METRIC RANK
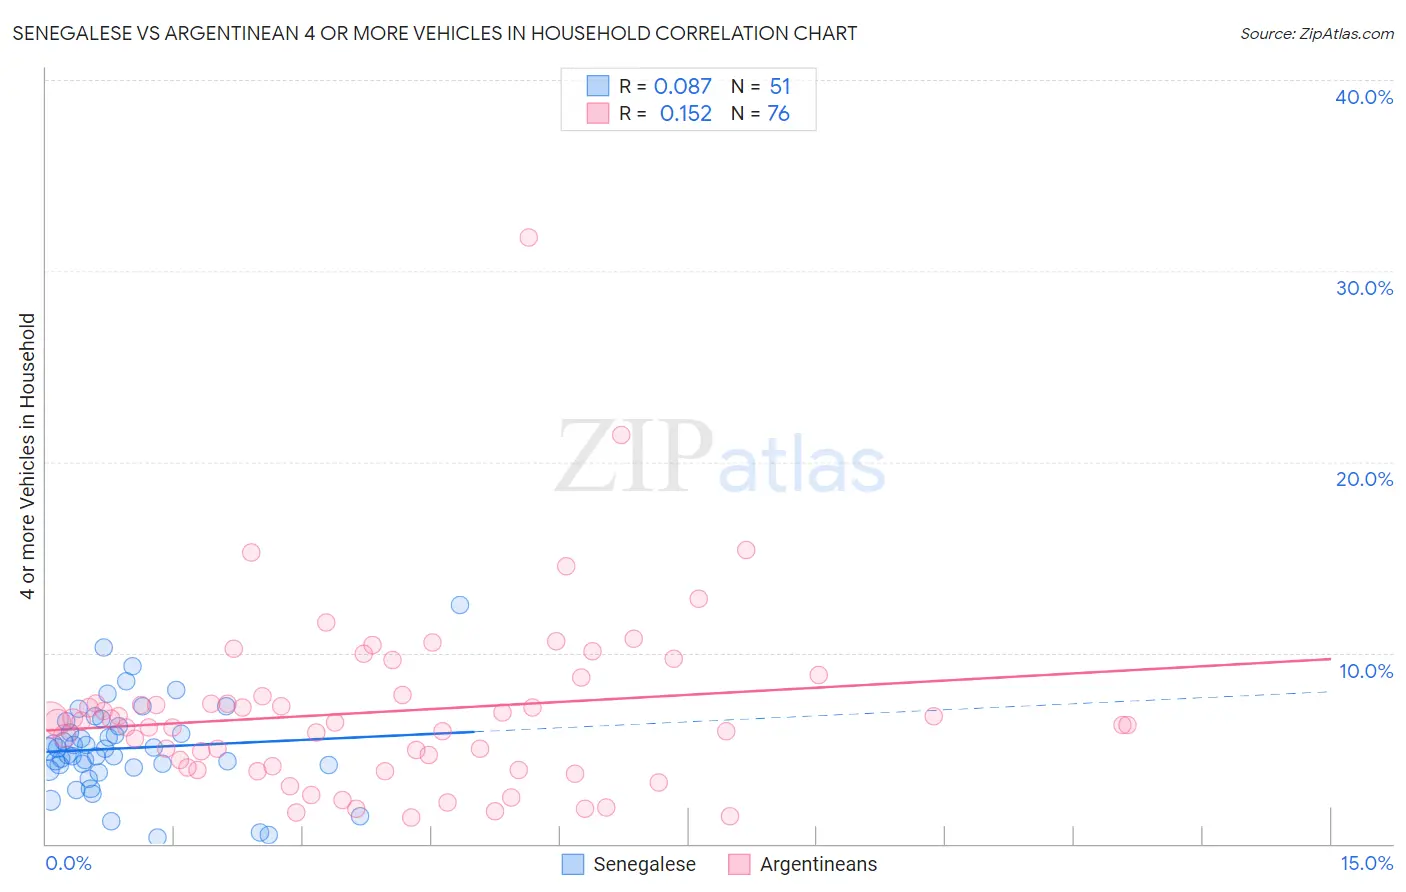
Senegalese vs Argentinean 4 or more Vehicles in Household Correlation Chart
The statistical analysis conducted on geographies consisting of 77,911,640 people shows a slight positive correlation between the proportion of Senegalese and percentage of households with 4 or more vehicles available in the United States with a correlation coefficient (R) of 0.087 and weighted average of 4.3%. Similarly, the statistical analysis conducted on geographies consisting of 295,773,782 people shows a poor positive correlation between the proportion of Argentineans and percentage of households with 4 or more vehicles available in the United States with a correlation coefficient (R) of 0.152 and weighted average of 6.2%, a difference of 42.7%.
4 or more Vehicles in Household Correlation Summary
| Measurement | Senegalese | Argentinean |
| Minimum | 0.34% | 1.3% |
| Maximum | 12.5% | 31.8% |
| Range | 12.2% | 30.4% |
| Mean | 5.0% | 6.9% |
| Median | 5.0% | 6.3% |
| Interquartile 25% (IQ1) | 4.0% | 4.0% |
| Interquartile 75% (IQ3) | 6.1% | 7.8% |
| Interquartile Range (IQR) | 2.1% | 3.7% |
| Standard Deviation (Sample) | 2.4% | 4.6% |
| Standard Deviation (Population) | 2.3% | 4.6% |
Similar Demographics by 4 or more Vehicles in Household
Demographics Similar to Senegalese by 4 or more Vehicles in Household
In terms of 4 or more vehicles in household, the demographic groups most similar to Senegalese are Trinidadian and Tobagonian (4.3%, a difference of 1.6%), Cape Verdean (4.4%, a difference of 1.8%), Immigrants from Senegal (4.2%, a difference of 1.9%), Immigrants from Ecuador (4.2%, a difference of 2.1%), and Immigrants from Jamaica (4.4%, a difference of 2.1%).
| Demographics | Rating | Rank | 4 or more Vehicles in Household |
| Immigrants | Haiti | 0.0 /100 | #320 | Tragic 4.5% |
| Ecuadorians | 0.0 /100 | #321 | Tragic 4.5% |
| Immigrants | Yemen | 0.0 /100 | #322 | Tragic 4.5% |
| Immigrants | Caribbean | 0.0 /100 | #323 | Tragic 4.4% |
| Soviet Union | 0.0 /100 | #324 | Tragic 4.4% |
| Immigrants | Jamaica | 0.0 /100 | #325 | Tragic 4.4% |
| Cape Verdeans | 0.0 /100 | #326 | Tragic 4.4% |
| Senegalese | 0.0 /100 | #327 | Tragic 4.3% |
| Trinidadians and Tobagonians | 0.0 /100 | #328 | Tragic 4.3% |
| Immigrants | Senegal | 0.0 /100 | #329 | Tragic 4.2% |
| Immigrants | Ecuador | 0.0 /100 | #330 | Tragic 4.2% |
| West Indians | 0.0 /100 | #331 | Tragic 4.2% |
| Immigrants | Dominica | 0.0 /100 | #332 | Tragic 4.2% |
| Immigrants | Albania | 0.0 /100 | #333 | Tragic 4.1% |
| Immigrants | Trinidad and Tobago | 0.0 /100 | #334 | Tragic 4.1% |
Demographics Similar to Argentineans by 4 or more Vehicles in Household
In terms of 4 or more vehicles in household, the demographic groups most similar to Argentineans are Immigrants from Sweden (6.2%, a difference of 0.0%), Tsimshian (6.2%, a difference of 0.070%), Immigrants from Kuwait (6.2%, a difference of 0.13%), Immigrants from Sri Lanka (6.1%, a difference of 0.45%), and Romanian (6.2%, a difference of 0.47%).
| Demographics | Rating | Rank | 4 or more Vehicles in Household |
| Kiowa | 34.7 /100 | #188 | Fair 6.2% |
| Immigrants | Eastern Asia | 33.3 /100 | #189 | Fair 6.2% |
| South Africans | 32.2 /100 | #190 | Fair 6.2% |
| Inupiat | 30.7 /100 | #191 | Fair 6.2% |
| Romanians | 30.7 /100 | #192 | Fair 6.2% |
| Immigrants | Kuwait | 28.0 /100 | #193 | Fair 6.2% |
| Immigrants | Sweden | 27.0 /100 | #194 | Fair 6.2% |
| Argentineans | 27.0 /100 | #195 | Fair 6.2% |
| Tsimshian | 26.4 /100 | #196 | Fair 6.2% |
| Immigrants | Sri Lanka | 23.7 /100 | #197 | Fair 6.1% |
| Immigrants | Portugal | 22.3 /100 | #198 | Fair 6.1% |
| Immigrants | Norway | 21.8 /100 | #199 | Fair 6.1% |
| Latvians | 21.7 /100 | #200 | Fair 6.1% |
| Egyptians | 21.4 /100 | #201 | Fair 6.1% |
| Immigrants | South Central Asia | 21.3 /100 | #202 | Fair 6.1% |