Bolivian vs Immigrants from Ecuador 1 or more Vehicles in Household
COMPARE
Bolivian
Immigrants from Ecuador
1 or more Vehicles in Household
1 or more Vehicles in Household Comparison
Bolivians
Immigrants from Ecuador
91.5%
1 OR MORE VEHICLES IN HOUSEHOLD
99.4/ 100
METRIC RATING
80th/ 347
METRIC RANK
76.2%
1 OR MORE VEHICLES IN HOUSEHOLD
0.0/ 100
METRIC RATING
333rd/ 347
METRIC RANK
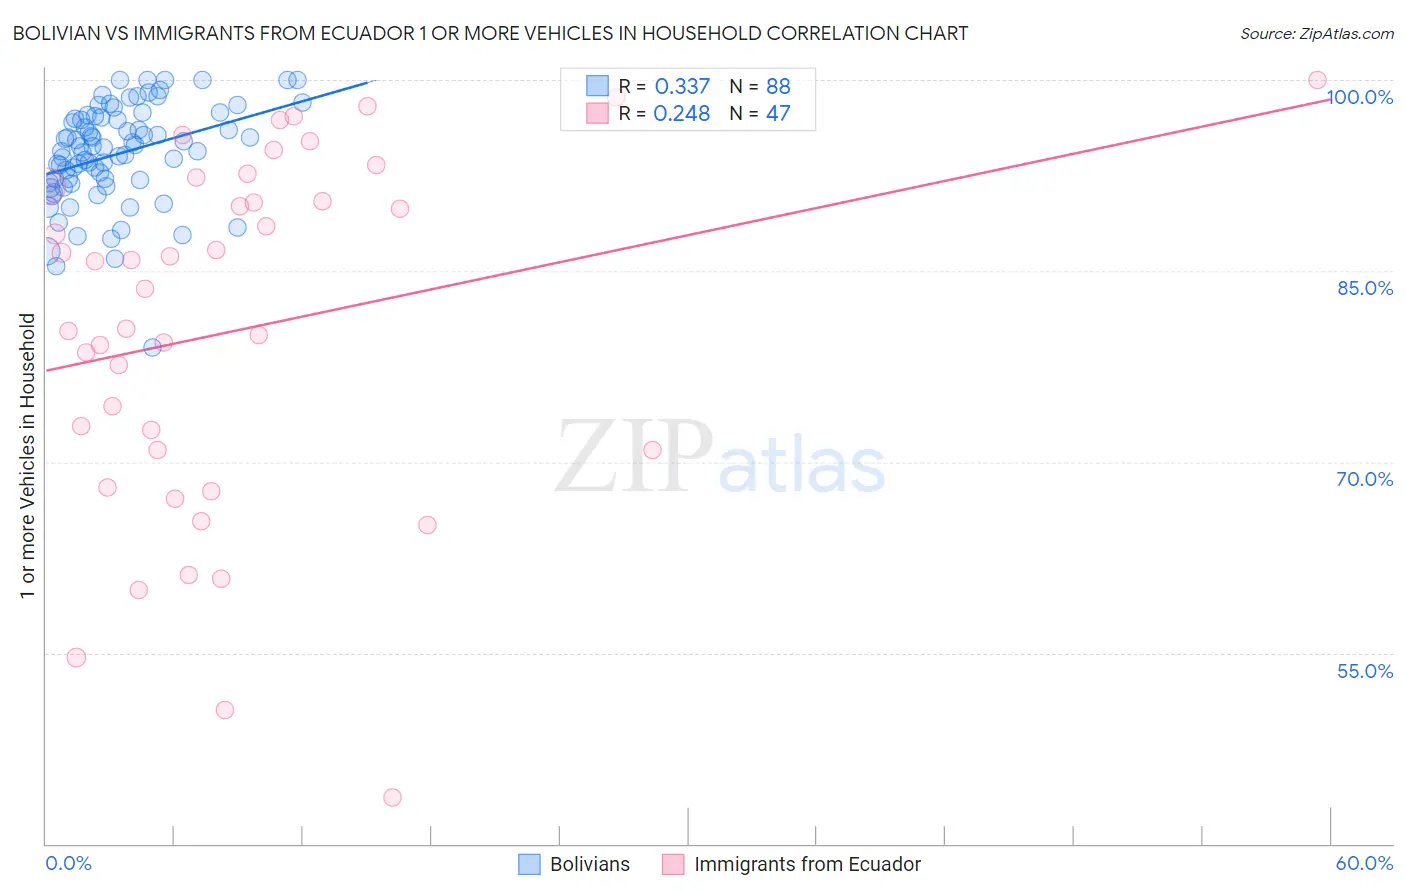
Bolivian vs Immigrants from Ecuador 1 or more Vehicles in Household Correlation Chart
The statistical analysis conducted on geographies consisting of 184,646,789 people shows a mild positive correlation between the proportion of Bolivians and percentage of households with 1 or more vehicles available in the United States with a correlation coefficient (R) of 0.337 and weighted average of 91.5%. Similarly, the statistical analysis conducted on geographies consisting of 270,903,190 people shows a weak positive correlation between the proportion of Immigrants from Ecuador and percentage of households with 1 or more vehicles available in the United States with a correlation coefficient (R) of 0.248 and weighted average of 76.2%, a difference of 20.0%.
1 or more Vehicles in Household Correlation Summary
| Measurement | Bolivian | Immigrants from Ecuador |
| Minimum | 79.0% | 43.6% |
| Maximum | 100.0% | 100.0% |
| Range | 21.0% | 56.4% |
| Mean | 94.2% | 80.4% |
| Median | 94.7% | 83.6% |
| Interquartile 25% (IQ1) | 92.0% | 70.9% |
| Interquartile 75% (IQ3) | 97.0% | 91.7% |
| Interquartile Range (IQR) | 5.0% | 20.7% |
| Standard Deviation (Sample) | 3.9% | 13.9% |
| Standard Deviation (Population) | 3.9% | 13.7% |
Similar Demographics by 1 or more Vehicles in Household
Demographics Similar to Bolivians by 1 or more Vehicles in Household
In terms of 1 or more vehicles in household, the demographic groups most similar to Bolivians are Immigrants from South Central Asia (91.5%, a difference of 0.0%), Iranian (91.5%, a difference of 0.020%), Immigrants from Philippines (91.5%, a difference of 0.030%), Immigrants from South Eastern Asia (91.4%, a difference of 0.030%), and Lebanese (91.4%, a difference of 0.040%).
| Demographics | Rating | Rank | 1 or more Vehicles in Household |
| Immigrants | Iran | 99.7 /100 | #73 | Exceptional 91.7% |
| Immigrants | Lebanon | 99.6 /100 | #74 | Exceptional 91.6% |
| Portuguese | 99.5 /100 | #75 | Exceptional 91.6% |
| Cubans | 99.5 /100 | #76 | Exceptional 91.5% |
| Immigrants | Philippines | 99.4 /100 | #77 | Exceptional 91.5% |
| Iranians | 99.4 /100 | #78 | Exceptional 91.5% |
| Immigrants | South Central Asia | 99.4 /100 | #79 | Exceptional 91.5% |
| Bolivians | 99.4 /100 | #80 | Exceptional 91.5% |
| Immigrants | South Eastern Asia | 99.3 /100 | #81 | Exceptional 91.4% |
| Lebanese | 99.3 /100 | #82 | Exceptional 91.4% |
| Immigrants | England | 99.3 /100 | #83 | Exceptional 91.4% |
| Jordanians | 99.3 /100 | #84 | Exceptional 91.4% |
| Tsimshian | 99.3 /100 | #85 | Exceptional 91.4% |
| Osage | 99.2 /100 | #86 | Exceptional 91.4% |
| Immigrants | Germany | 99.2 /100 | #87 | Exceptional 91.4% |
Demographics Similar to Immigrants from Ecuador by 1 or more Vehicles in Household
In terms of 1 or more vehicles in household, the demographic groups most similar to Immigrants from Ecuador are Trinidadian and Tobagonian (76.3%, a difference of 0.10%), West Indian (76.4%, a difference of 0.18%), Immigrants from Trinidad and Tobago (76.8%, a difference of 0.73%), Immigrants from Dominica (77.8%, a difference of 2.1%), and Ecuadorian (77.9%, a difference of 2.2%).
| Demographics | Rating | Rank | 1 or more Vehicles in Household |
| Immigrants | West Indies | 0.0 /100 | #326 | Tragic 79.5% |
| Immigrants | Senegal | 0.0 /100 | #327 | Tragic 79.0% |
| Ecuadorians | 0.0 /100 | #328 | Tragic 77.9% |
| Immigrants | Dominica | 0.0 /100 | #329 | Tragic 77.8% |
| Immigrants | Trinidad and Tobago | 0.0 /100 | #330 | Tragic 76.8% |
| West Indians | 0.0 /100 | #331 | Tragic 76.4% |
| Trinidadians and Tobagonians | 0.0 /100 | #332 | Tragic 76.3% |
| Immigrants | Ecuador | 0.0 /100 | #333 | Tragic 76.2% |
| Immigrants | Bangladesh | 0.0 /100 | #334 | Tragic 74.3% |
| Barbadians | 0.0 /100 | #335 | Tragic 74.0% |
| Vietnamese | 0.0 /100 | #336 | Tragic 73.8% |
| Immigrants | Uzbekistan | 0.0 /100 | #337 | Tragic 73.4% |
| Inupiat | 0.0 /100 | #338 | Tragic 71.5% |
| Guyanese | 0.0 /100 | #339 | Tragic 70.8% |
| Dominicans | 0.0 /100 | #340 | Tragic 70.7% |