Russian vs Immigrants from Iraq 1 or more Vehicles in Household
COMPARE
Russian
Immigrants from Iraq
1 or more Vehicles in Household
1 or more Vehicles in Household Comparison
Russians
Immigrants from Iraq
88.7%
1 OR MORE VEHICLES IN HOUSEHOLD
5.0/ 100
METRIC RATING
231st/ 347
METRIC RANK
92.5%
1 OR MORE VEHICLES IN HOUSEHOLD
100.0/ 100
METRIC RATING
25th/ 347
METRIC RANK
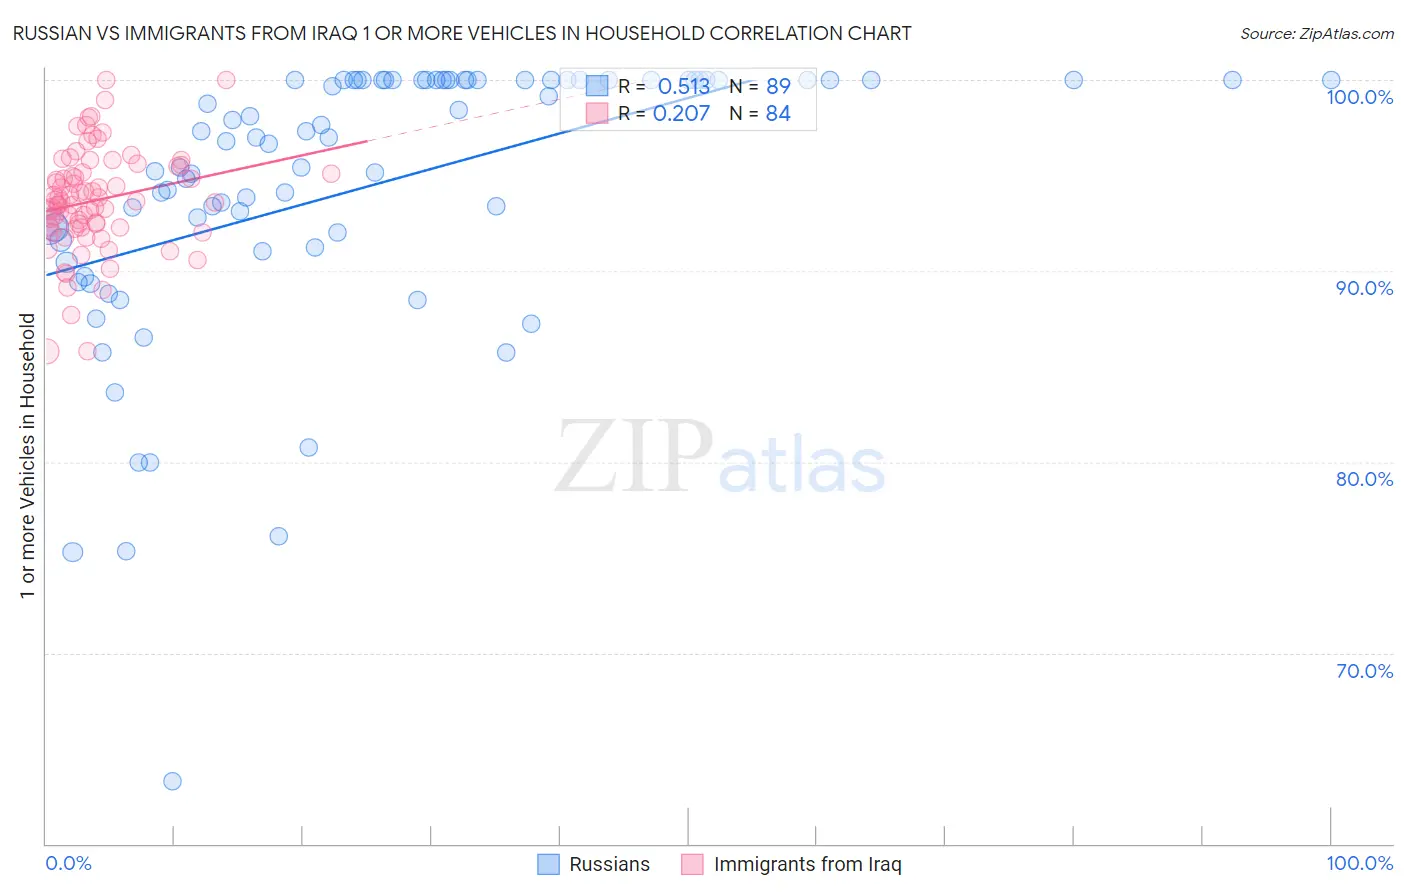
Russian vs Immigrants from Iraq 1 or more Vehicles in Household Correlation Chart
The statistical analysis conducted on geographies consisting of 511,739,915 people shows a substantial positive correlation between the proportion of Russians and percentage of households with 1 or more vehicles available in the United States with a correlation coefficient (R) of 0.513 and weighted average of 88.7%. Similarly, the statistical analysis conducted on geographies consisting of 194,729,902 people shows a weak positive correlation between the proportion of Immigrants from Iraq and percentage of households with 1 or more vehicles available in the United States with a correlation coefficient (R) of 0.207 and weighted average of 92.5%, a difference of 4.4%.
1 or more Vehicles in Household Correlation Summary
| Measurement | Russian | Immigrants from Iraq |
| Minimum | 63.3% | 85.8% |
| Maximum | 100.0% | 100.0% |
| Range | 36.7% | 14.2% |
| Mean | 94.4% | 93.7% |
| Median | 97.0% | 93.6% |
| Interquartile 25% (IQ1) | 91.4% | 92.3% |
| Interquartile 75% (IQ3) | 100.0% | 95.3% |
| Interquartile Range (IQR) | 8.6% | 3.1% |
| Standard Deviation (Sample) | 7.2% | 2.7% |
| Standard Deviation (Population) | 7.1% | 2.7% |
Similar Demographics by 1 or more Vehicles in Household
Demographics Similar to Russians by 1 or more Vehicles in Household
In terms of 1 or more vehicles in household, the demographic groups most similar to Russians are Immigrants from Japan (88.7%, a difference of 0.0%), Immigrants from Sierra Leone (88.7%, a difference of 0.020%), Houma (88.6%, a difference of 0.020%), Immigrants from Romania (88.7%, a difference of 0.030%), and Immigrants from Peru (88.6%, a difference of 0.030%).
| Demographics | Rating | Rank | 1 or more Vehicles in Household |
| Immigrants | Hong Kong | 6.2 /100 | #224 | Tragic 88.7% |
| Cree | 6.0 /100 | #225 | Tragic 88.7% |
| Cheyenne | 5.7 /100 | #226 | Tragic 88.7% |
| Ute | 5.6 /100 | #227 | Tragic 88.7% |
| Immigrants | Norway | 5.5 /100 | #228 | Tragic 88.7% |
| Immigrants | Romania | 5.4 /100 | #229 | Tragic 88.7% |
| Immigrants | Sierra Leone | 5.2 /100 | #230 | Tragic 88.7% |
| Russians | 5.0 /100 | #231 | Tragic 88.7% |
| Immigrants | Japan | 4.9 /100 | #232 | Tragic 88.7% |
| Houma | 4.8 /100 | #233 | Tragic 88.6% |
| Immigrants | Peru | 4.7 /100 | #234 | Tragic 88.6% |
| Paiute | 4.6 /100 | #235 | Tragic 88.6% |
| Immigrants | Pakistan | 4.5 /100 | #236 | Tragic 88.6% |
| Immigrants | Turkey | 4.4 /100 | #237 | Tragic 88.6% |
| Immigrants | Somalia | 4.2 /100 | #238 | Tragic 88.6% |
Demographics Similar to Immigrants from Iraq by 1 or more Vehicles in Household
In terms of 1 or more vehicles in household, the demographic groups most similar to Immigrants from Iraq are Yaqui (92.6%, a difference of 0.020%), British (92.5%, a difference of 0.020%), American (92.5%, a difference of 0.060%), Nepalese (92.6%, a difference of 0.090%), and Sri Lankan (92.5%, a difference of 0.10%).
| Demographics | Rating | Rank | 1 or more Vehicles in Household |
| Welsh | 100.0 /100 | #18 | Exceptional 93.0% |
| Tongans | 100.0 /100 | #19 | Exceptional 92.9% |
| Arapaho | 100.0 /100 | #20 | Exceptional 92.7% |
| Ottawa | 100.0 /100 | #21 | Exceptional 92.7% |
| French | 100.0 /100 | #22 | Exceptional 92.7% |
| Nepalese | 100.0 /100 | #23 | Exceptional 92.6% |
| Yaqui | 100.0 /100 | #24 | Exceptional 92.6% |
| Immigrants | Iraq | 100.0 /100 | #25 | Exceptional 92.5% |
| British | 100.0 /100 | #26 | Exceptional 92.5% |
| Americans | 100.0 /100 | #27 | Exceptional 92.5% |
| Sri Lankans | 100.0 /100 | #28 | Exceptional 92.5% |
| Native Hawaiians | 100.0 /100 | #29 | Exceptional 92.4% |
| Finns | 100.0 /100 | #30 | Exceptional 92.4% |
| Samoans | 100.0 /100 | #31 | Exceptional 92.4% |
| Basques | 100.0 /100 | #32 | Exceptional 92.4% |