Peruvian vs Spanish 1 or more Vehicles in Household
COMPARE
Peruvian
Spanish
1 or more Vehicles in Household
1 or more Vehicles in Household Comparison
Peruvians
Spanish
88.8%
1 OR MORE VEHICLES IN HOUSEHOLD
7.9/ 100
METRIC RATING
221st/ 347
METRIC RANK
92.3%
1 OR MORE VEHICLES IN HOUSEHOLD
99.9/ 100
METRIC RATING
43rd/ 347
METRIC RANK
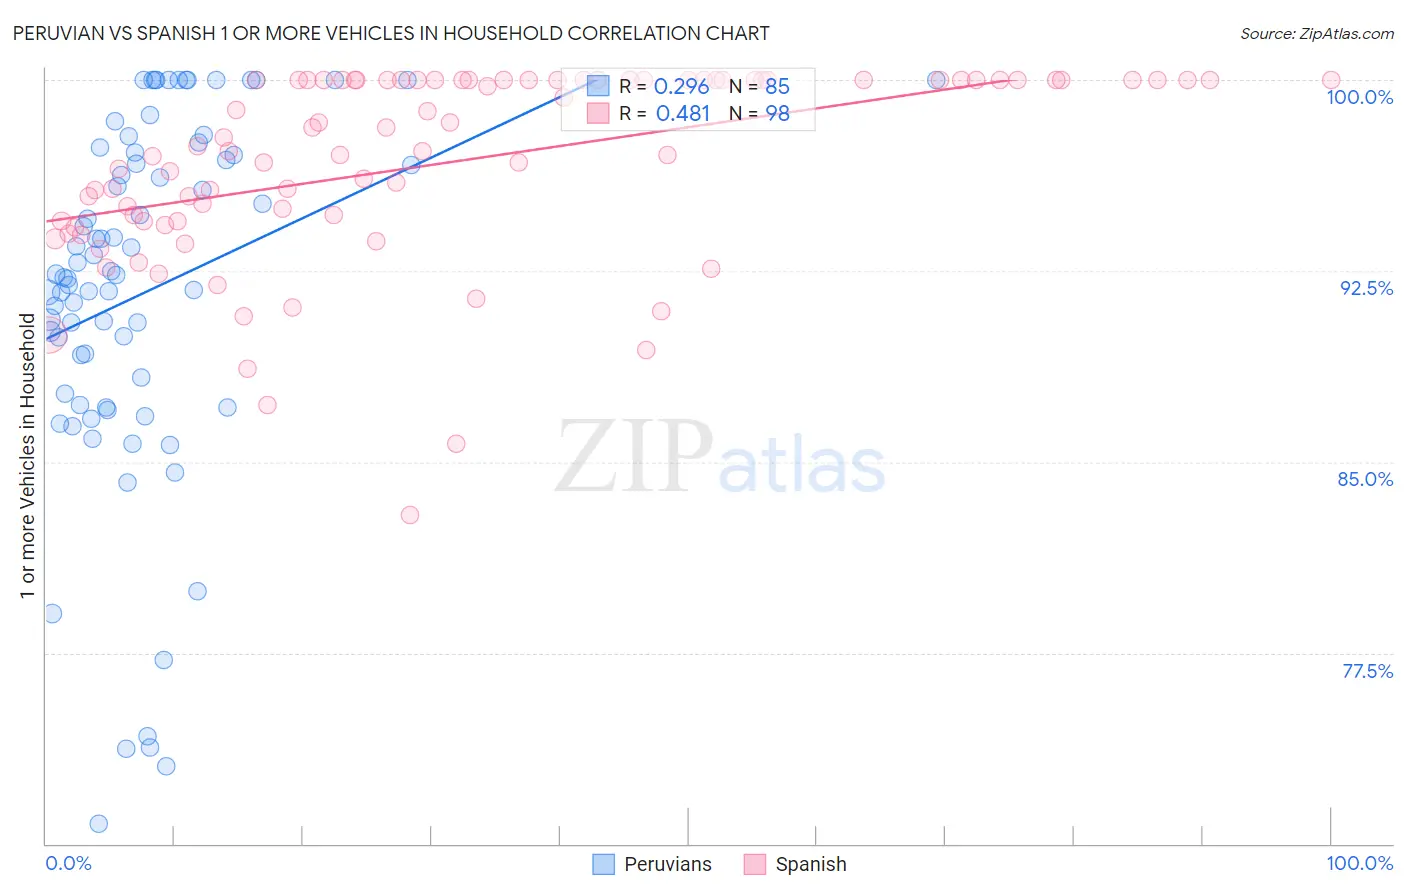
Peruvian vs Spanish 1 or more Vehicles in Household Correlation Chart
The statistical analysis conducted on geographies consisting of 363,028,617 people shows a weak positive correlation between the proportion of Peruvians and percentage of households with 1 or more vehicles available in the United States with a correlation coefficient (R) of 0.296 and weighted average of 88.8%. Similarly, the statistical analysis conducted on geographies consisting of 421,966,213 people shows a moderate positive correlation between the proportion of Spanish and percentage of households with 1 or more vehicles available in the United States with a correlation coefficient (R) of 0.481 and weighted average of 92.3%, a difference of 3.9%.
1 or more Vehicles in Household Correlation Summary
| Measurement | Peruvian | Spanish |
| Minimum | 70.8% | 82.9% |
| Maximum | 100.0% | 100.0% |
| Range | 29.2% | 17.1% |
| Mean | 91.7% | 96.8% |
| Median | 92.3% | 97.6% |
| Interquartile 25% (IQ1) | 87.5% | 94.5% |
| Interquartile 75% (IQ3) | 97.1% | 100.0% |
| Interquartile Range (IQR) | 9.6% | 5.5% |
| Standard Deviation (Sample) | 7.0% | 3.7% |
| Standard Deviation (Population) | 7.0% | 3.7% |
Similar Demographics by 1 or more Vehicles in Household
Demographics Similar to Peruvians by 1 or more Vehicles in Household
In terms of 1 or more vehicles in household, the demographic groups most similar to Peruvians are Immigrants from Zaire (88.8%, a difference of 0.010%), Ugandan (88.9%, a difference of 0.040%), Immigrants from Guatemala (88.9%, a difference of 0.040%), Argentinean (88.9%, a difference of 0.050%), and Uruguayan (88.8%, a difference of 0.050%).
| Demographics | Rating | Rank | 1 or more Vehicles in Household |
| Immigrants | Hungary | 11.9 /100 | #214 | Poor 89.0% |
| Immigrants | Sri Lanka | 10.2 /100 | #215 | Poor 88.9% |
| Immigrants | Argentina | 9.4 /100 | #216 | Tragic 88.9% |
| Argentineans | 8.8 /100 | #217 | Tragic 88.9% |
| Ugandans | 8.7 /100 | #218 | Tragic 88.9% |
| Immigrants | Guatemala | 8.6 /100 | #219 | Tragic 88.9% |
| Immigrants | Zaire | 8.1 /100 | #220 | Tragic 88.8% |
| Peruvians | 7.9 /100 | #221 | Tragic 88.8% |
| Uruguayans | 7.0 /100 | #222 | Tragic 88.8% |
| Immigrants | South America | 7.0 /100 | #223 | Tragic 88.8% |
| Immigrants | Hong Kong | 6.2 /100 | #224 | Tragic 88.7% |
| Cree | 6.0 /100 | #225 | Tragic 88.7% |
| Cheyenne | 5.7 /100 | #226 | Tragic 88.7% |
| Ute | 5.6 /100 | #227 | Tragic 88.7% |
| Immigrants | Norway | 5.5 /100 | #228 | Tragic 88.7% |
Demographics Similar to Spanish by 1 or more Vehicles in Household
In terms of 1 or more vehicles in household, the demographic groups most similar to Spanish are Chickasaw (92.3%, a difference of 0.0%), Immigrants from Taiwan (92.3%, a difference of 0.010%), Choctaw (92.2%, a difference of 0.020%), Swiss (92.3%, a difference of 0.030%), and Creek (92.3%, a difference of 0.030%).
| Demographics | Rating | Rank | 1 or more Vehicles in Household |
| Malaysians | 99.9 /100 | #36 | Exceptional 92.3% |
| French Canadians | 99.9 /100 | #37 | Exceptional 92.3% |
| Immigrants | Vietnam | 99.9 /100 | #38 | Exceptional 92.3% |
| Swiss | 99.9 /100 | #39 | Exceptional 92.3% |
| Creek | 99.9 /100 | #40 | Exceptional 92.3% |
| Immigrants | Taiwan | 99.9 /100 | #41 | Exceptional 92.3% |
| Chickasaw | 99.9 /100 | #42 | Exceptional 92.3% |
| Spanish | 99.9 /100 | #43 | Exceptional 92.3% |
| Choctaw | 99.9 /100 | #44 | Exceptional 92.2% |
| Immigrants | Nonimmigrants | 99.9 /100 | #45 | Exceptional 92.2% |
| Immigrants | Fiji | 99.9 /100 | #46 | Exceptional 92.2% |
| Northern Europeans | 99.9 /100 | #47 | Exceptional 92.2% |
| Belgians | 99.9 /100 | #48 | Exceptional 92.1% |
| Afghans | 99.9 /100 | #49 | Exceptional 92.1% |
| Guamanians/Chamorros | 99.9 /100 | #50 | Exceptional 92.1% |