Peruvian vs Danish 1 or more Vehicles in Household
COMPARE
Peruvian
Danish
1 or more Vehicles in Household
1 or more Vehicles in Household Comparison
Peruvians
Danes
88.8%
1 OR MORE VEHICLES IN HOUSEHOLD
7.9/ 100
METRIC RATING
221st/ 347
METRIC RANK
93.5%
1 OR MORE VEHICLES IN HOUSEHOLD
100.0/ 100
METRIC RATING
6th/ 347
METRIC RANK
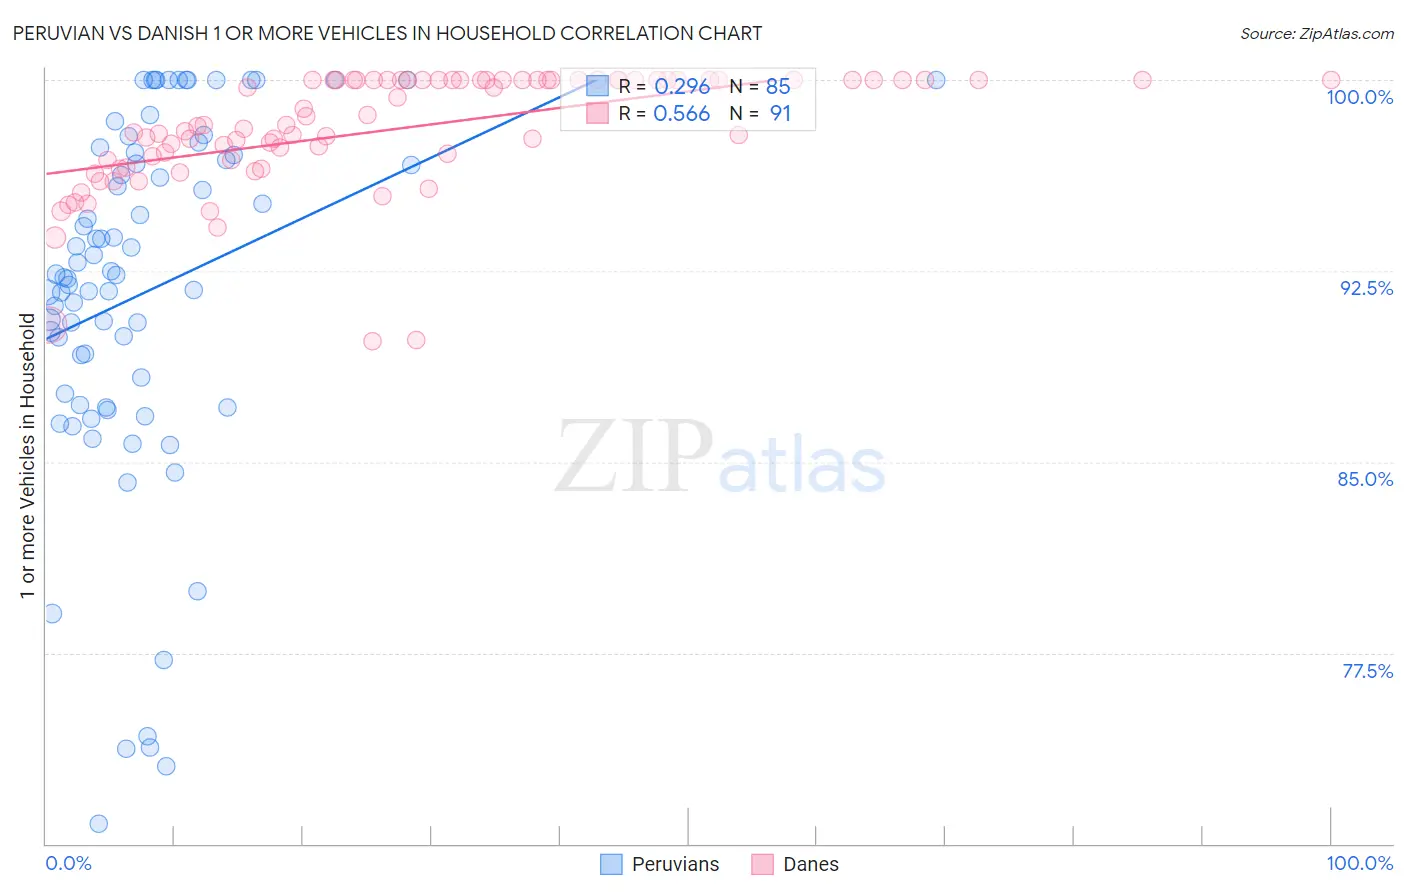
Peruvian vs Danish 1 or more Vehicles in Household Correlation Chart
The statistical analysis conducted on geographies consisting of 363,028,617 people shows a weak positive correlation between the proportion of Peruvians and percentage of households with 1 or more vehicles available in the United States with a correlation coefficient (R) of 0.296 and weighted average of 88.8%. Similarly, the statistical analysis conducted on geographies consisting of 473,956,098 people shows a substantial positive correlation between the proportion of Danes and percentage of households with 1 or more vehicles available in the United States with a correlation coefficient (R) of 0.566 and weighted average of 93.5%, a difference of 5.3%.
1 or more Vehicles in Household Correlation Summary
| Measurement | Peruvian | Danish |
| Minimum | 70.8% | 89.7% |
| Maximum | 100.0% | 100.0% |
| Range | 29.2% | 10.3% |
| Mean | 91.7% | 98.0% |
| Median | 92.3% | 98.2% |
| Interquartile 25% (IQ1) | 87.5% | 96.9% |
| Interquartile 75% (IQ3) | 97.1% | 100.0% |
| Interquartile Range (IQR) | 9.6% | 3.1% |
| Standard Deviation (Sample) | 7.0% | 2.3% |
| Standard Deviation (Population) | 7.0% | 2.3% |
Similar Demographics by 1 or more Vehicles in Household
Demographics Similar to Peruvians by 1 or more Vehicles in Household
In terms of 1 or more vehicles in household, the demographic groups most similar to Peruvians are Immigrants from Zaire (88.8%, a difference of 0.010%), Ugandan (88.9%, a difference of 0.040%), Immigrants from Guatemala (88.9%, a difference of 0.040%), Argentinean (88.9%, a difference of 0.050%), and Uruguayan (88.8%, a difference of 0.050%).
| Demographics | Rating | Rank | 1 or more Vehicles in Household |
| Immigrants | Hungary | 11.9 /100 | #214 | Poor 89.0% |
| Immigrants | Sri Lanka | 10.2 /100 | #215 | Poor 88.9% |
| Immigrants | Argentina | 9.4 /100 | #216 | Tragic 88.9% |
| Argentineans | 8.8 /100 | #217 | Tragic 88.9% |
| Ugandans | 8.7 /100 | #218 | Tragic 88.9% |
| Immigrants | Guatemala | 8.6 /100 | #219 | Tragic 88.9% |
| Immigrants | Zaire | 8.1 /100 | #220 | Tragic 88.8% |
| Peruvians | 7.9 /100 | #221 | Tragic 88.8% |
| Uruguayans | 7.0 /100 | #222 | Tragic 88.8% |
| Immigrants | South America | 7.0 /100 | #223 | Tragic 88.8% |
| Immigrants | Hong Kong | 6.2 /100 | #224 | Tragic 88.7% |
| Cree | 6.0 /100 | #225 | Tragic 88.7% |
| Cheyenne | 5.7 /100 | #226 | Tragic 88.7% |
| Ute | 5.6 /100 | #227 | Tragic 88.7% |
| Immigrants | Norway | 5.5 /100 | #228 | Tragic 88.7% |
Demographics Similar to Danes by 1 or more Vehicles in Household
In terms of 1 or more vehicles in household, the demographic groups most similar to Danes are Yakama (93.6%, a difference of 0.020%), German (93.6%, a difference of 0.12%), Norwegian (93.7%, a difference of 0.16%), Scottish (93.4%, a difference of 0.19%), and Swedish (93.3%, a difference of 0.23%).
| Demographics | Rating | Rank | 1 or more Vehicles in Household |
| Luxembourgers | 100.0 /100 | #1 | Exceptional 94.8% |
| English | 100.0 /100 | #2 | Exceptional 93.8% |
| Norwegians | 100.0 /100 | #3 | Exceptional 93.7% |
| Germans | 100.0 /100 | #4 | Exceptional 93.6% |
| Yakama | 100.0 /100 | #5 | Exceptional 93.6% |
| Danes | 100.0 /100 | #6 | Exceptional 93.5% |
| Scottish | 100.0 /100 | #7 | Exceptional 93.4% |
| Swedes | 100.0 /100 | #8 | Exceptional 93.3% |
| Scotch-Irish | 100.0 /100 | #9 | Exceptional 93.3% |
| Dutch | 100.0 /100 | #10 | Exceptional 93.3% |
| Czechs | 100.0 /100 | #11 | Exceptional 93.3% |
| Scandinavians | 100.0 /100 | #12 | Exceptional 93.1% |
| Whites/Caucasians | 100.0 /100 | #13 | Exceptional 93.1% |
| Irish | 100.0 /100 | #14 | Exceptional 93.1% |
| Mexicans | 100.0 /100 | #15 | Exceptional 93.0% |