Slavic vs Spanish 1 or more Vehicles in Household
COMPARE
Slavic
Spanish
1 or more Vehicles in Household
1 or more Vehicles in Household Comparison
Slavs
Spanish
91.2%
1 OR MORE VEHICLES IN HOUSEHOLD
98.7/ 100
METRIC RATING
98th/ 347
METRIC RANK
92.3%
1 OR MORE VEHICLES IN HOUSEHOLD
99.9/ 100
METRIC RATING
43rd/ 347
METRIC RANK
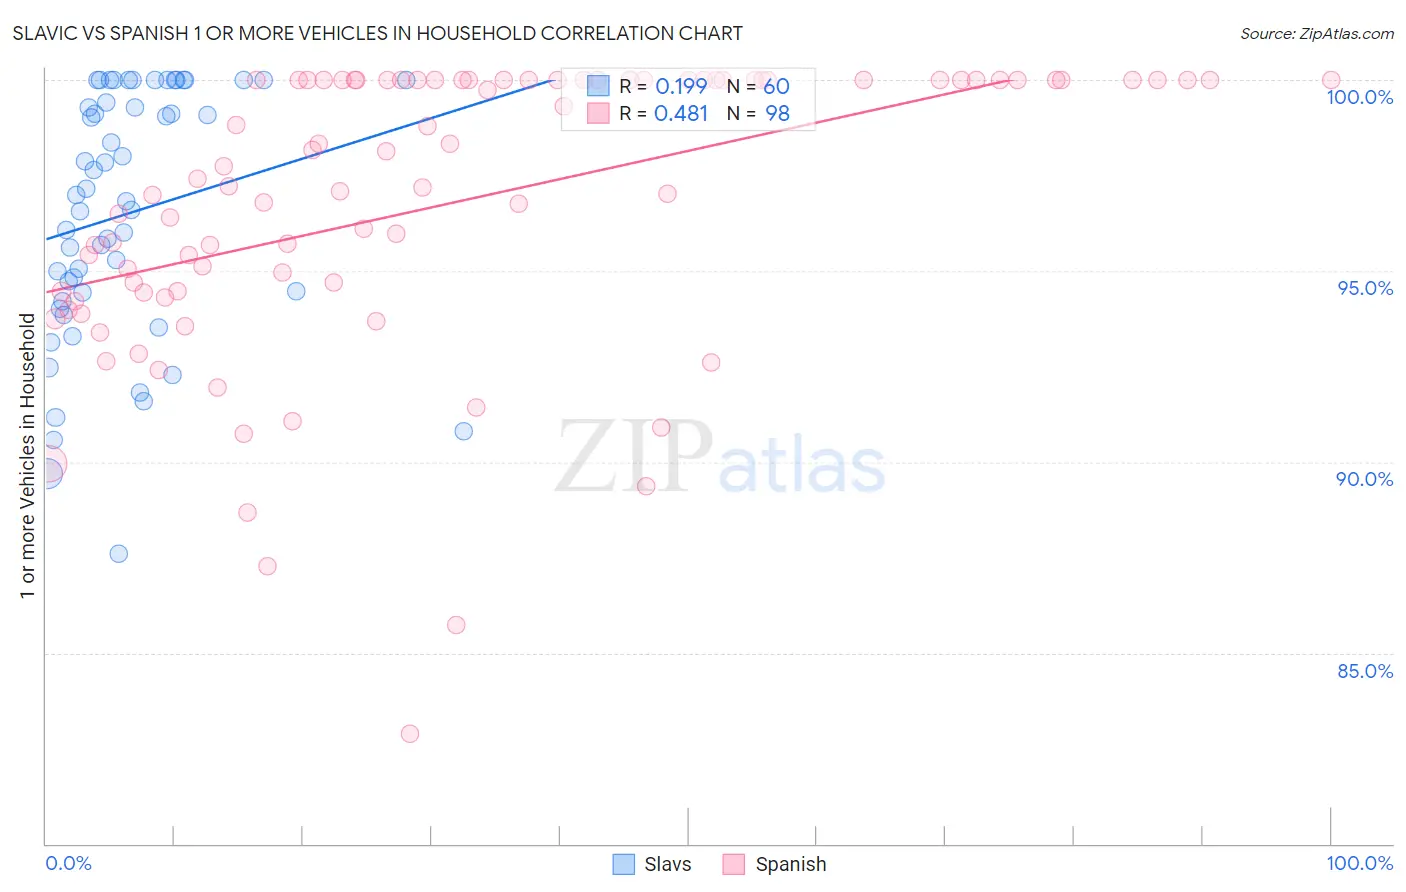
Slavic vs Spanish 1 or more Vehicles in Household Correlation Chart
The statistical analysis conducted on geographies consisting of 270,821,380 people shows a poor positive correlation between the proportion of Slavs and percentage of households with 1 or more vehicles available in the United States with a correlation coefficient (R) of 0.199 and weighted average of 91.2%. Similarly, the statistical analysis conducted on geographies consisting of 421,966,213 people shows a moderate positive correlation between the proportion of Spanish and percentage of households with 1 or more vehicles available in the United States with a correlation coefficient (R) of 0.481 and weighted average of 92.3%, a difference of 1.2%.
1 or more Vehicles in Household Correlation Summary
| Measurement | Slavic | Spanish |
| Minimum | 87.6% | 82.9% |
| Maximum | 100.0% | 100.0% |
| Range | 12.4% | 17.1% |
| Mean | 96.5% | 96.8% |
| Median | 96.9% | 97.6% |
| Interquartile 25% (IQ1) | 94.3% | 94.5% |
| Interquartile 75% (IQ3) | 99.7% | 100.0% |
| Interquartile Range (IQR) | 5.4% | 5.5% |
| Standard Deviation (Sample) | 3.3% | 3.7% |
| Standard Deviation (Population) | 3.2% | 3.7% |
Similar Demographics by 1 or more Vehicles in Household
Demographics Similar to Slavs by 1 or more Vehicles in Household
In terms of 1 or more vehicles in household, the demographic groups most similar to Slavs are Immigrants from Bolivia (91.2%, a difference of 0.020%), Immigrants from Central America (91.1%, a difference of 0.060%), Bulgarian (91.1%, a difference of 0.070%), Seminole (91.1%, a difference of 0.090%), and Yugoslavian (91.1%, a difference of 0.10%).
| Demographics | Rating | Rank | 1 or more Vehicles in Household |
| Immigrants | Jordan | 99.2 /100 | #91 | Exceptional 91.4% |
| Bhutanese | 99.2 /100 | #92 | Exceptional 91.4% |
| Immigrants | North America | 99.2 /100 | #93 | Exceptional 91.4% |
| Immigrants | Cuba | 99.1 /100 | #94 | Exceptional 91.3% |
| Austrians | 99.0 /100 | #95 | Exceptional 91.3% |
| Potawatomi | 99.0 /100 | #96 | Exceptional 91.3% |
| Pakistanis | 99.0 /100 | #97 | Exceptional 91.3% |
| Slavs | 98.7 /100 | #98 | Exceptional 91.2% |
| Immigrants | Bolivia | 98.6 /100 | #99 | Exceptional 91.2% |
| Immigrants | Central America | 98.4 /100 | #100 | Exceptional 91.1% |
| Bulgarians | 98.4 /100 | #101 | Exceptional 91.1% |
| Seminole | 98.3 /100 | #102 | Exceptional 91.1% |
| Yugoslavians | 98.3 /100 | #103 | Exceptional 91.1% |
| Asians | 98.2 /100 | #104 | Exceptional 91.1% |
| Laotians | 98.0 /100 | #105 | Exceptional 91.0% |
Demographics Similar to Spanish by 1 or more Vehicles in Household
In terms of 1 or more vehicles in household, the demographic groups most similar to Spanish are Chickasaw (92.3%, a difference of 0.0%), Immigrants from Taiwan (92.3%, a difference of 0.010%), Choctaw (92.2%, a difference of 0.020%), Swiss (92.3%, a difference of 0.030%), and Creek (92.3%, a difference of 0.030%).
| Demographics | Rating | Rank | 1 or more Vehicles in Household |
| Malaysians | 99.9 /100 | #36 | Exceptional 92.3% |
| French Canadians | 99.9 /100 | #37 | Exceptional 92.3% |
| Immigrants | Vietnam | 99.9 /100 | #38 | Exceptional 92.3% |
| Swiss | 99.9 /100 | #39 | Exceptional 92.3% |
| Creek | 99.9 /100 | #40 | Exceptional 92.3% |
| Immigrants | Taiwan | 99.9 /100 | #41 | Exceptional 92.3% |
| Chickasaw | 99.9 /100 | #42 | Exceptional 92.3% |
| Spanish | 99.9 /100 | #43 | Exceptional 92.3% |
| Choctaw | 99.9 /100 | #44 | Exceptional 92.2% |
| Immigrants | Nonimmigrants | 99.9 /100 | #45 | Exceptional 92.2% |
| Immigrants | Fiji | 99.9 /100 | #46 | Exceptional 92.2% |
| Northern Europeans | 99.9 /100 | #47 | Exceptional 92.2% |
| Belgians | 99.9 /100 | #48 | Exceptional 92.1% |
| Afghans | 99.9 /100 | #49 | Exceptional 92.1% |
| Guamanians/Chamorros | 99.9 /100 | #50 | Exceptional 92.1% |