Pennsylvania German vs Potawatomi Median Female Earnings
COMPARE
Pennsylvania German
Potawatomi
Median Female Earnings
Median Female Earnings Comparison
Pennsylvania Germans
Potawatomi
$34,802
MEDIAN FEMALE EARNINGS
0.0/ 100
METRIC RATING
315th/ 347
METRIC RANK
$34,739
MEDIAN FEMALE EARNINGS
0.0/ 100
METRIC RATING
317th/ 347
METRIC RANK
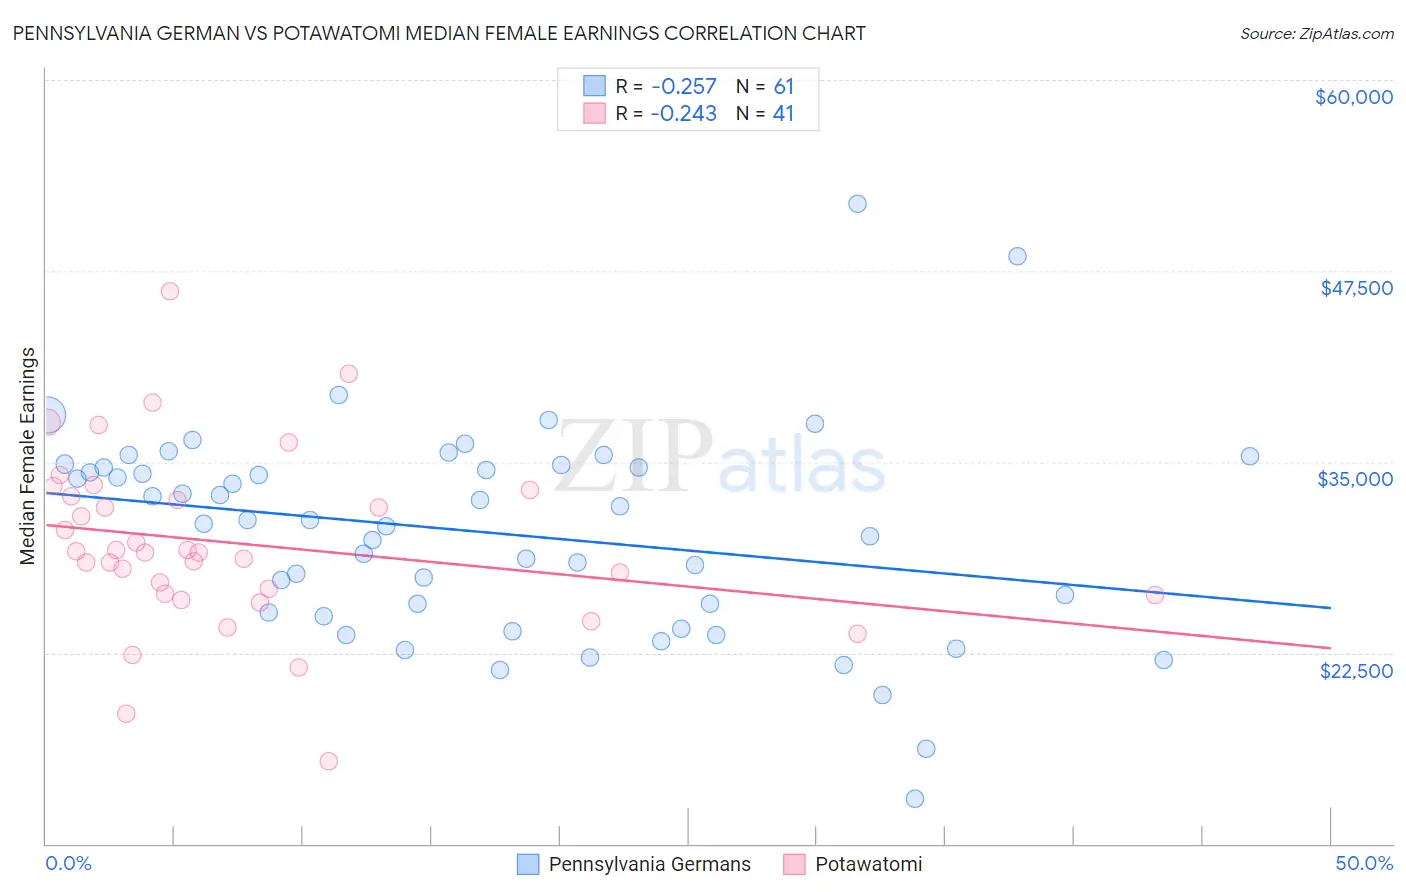
Pennsylvania German vs Potawatomi Median Female Earnings Correlation Chart
The statistical analysis conducted on geographies consisting of 233,955,345 people shows a weak negative correlation between the proportion of Pennsylvania Germans and median female earnings in the United States with a correlation coefficient (R) of -0.257 and weighted average of $34,802. Similarly, the statistical analysis conducted on geographies consisting of 117,757,146 people shows a weak negative correlation between the proportion of Potawatomi and median female earnings in the United States with a correlation coefficient (R) of -0.243 and weighted average of $34,739, a difference of 0.18%.
Median Female Earnings Correlation Summary
| Measurement | Pennsylvania German | Potawatomi |
| Minimum | $12,961 | $15,417 |
| Maximum | $51,875 | $46,172 |
| Range | $38,914 | $30,755 |
| Mean | $30,372 | $29,667 |
| Median | $31,194 | $29,066 |
| Interquartile 25% (IQ1) | $25,044 | $26,292 |
| Interquartile 75% (IQ3) | $34,733 | $32,931 |
| Interquartile Range (IQR) | $9,690 | $6,639 |
| Standard Deviation (Sample) | $6,887 | $5,830 |
| Standard Deviation (Population) | $6,830 | $5,758 |
Demographics Similar to Pennsylvania Germans and Potawatomi by Median Female Earnings
In terms of median female earnings, the demographic groups most similar to Pennsylvania Germans are Cherokee ($34,742, a difference of 0.17%), Apache ($34,895, a difference of 0.27%), Immigrants from Yemen ($34,693, a difference of 0.31%), Shoshone ($34,677, a difference of 0.36%), and Yaqui ($34,943, a difference of 0.40%). Similarly, the demographic groups most similar to Potawatomi are Cherokee ($34,742, a difference of 0.010%), Immigrants from Yemen ($34,693, a difference of 0.13%), Shoshone ($34,677, a difference of 0.18%), Immigrants from Honduras ($34,647, a difference of 0.27%), and Apache ($34,895, a difference of 0.45%).
| Demographics | Rating | Rank | Median Female Earnings |
| Fijians | 0.0 /100 | #306 | Tragic $35,114 |
| Sioux | 0.0 /100 | #307 | Tragic $35,063 |
| Immigrants | Bahamas | 0.0 /100 | #308 | Tragic $35,027 |
| Hondurans | 0.0 /100 | #309 | Tragic $35,013 |
| Chippewa | 0.0 /100 | #310 | Tragic $35,003 |
| Ute | 0.0 /100 | #311 | Tragic $34,960 |
| Yaqui | 0.0 /100 | #312 | Tragic $34,943 |
| Cubans | 0.0 /100 | #313 | Tragic $34,942 |
| Apache | 0.0 /100 | #314 | Tragic $34,895 |
| Pennsylvania Germans | 0.0 /100 | #315 | Tragic $34,802 |
| Cherokee | 0.0 /100 | #316 | Tragic $34,742 |
| Potawatomi | 0.0 /100 | #317 | Tragic $34,739 |
| Immigrants | Yemen | 0.0 /100 | #318 | Tragic $34,693 |
| Shoshone | 0.0 /100 | #319 | Tragic $34,677 |
| Immigrants | Honduras | 0.0 /100 | #320 | Tragic $34,647 |
| Hispanics or Latinos | 0.0 /100 | #321 | Tragic $34,421 |
| Chickasaw | 0.0 /100 | #322 | Tragic $34,414 |
| Seminole | 0.0 /100 | #323 | Tragic $34,385 |
| Immigrants | Congo | 0.0 /100 | #324 | Tragic $34,317 |
| Dutch West Indians | 0.0 /100 | #325 | Tragic $34,106 |
| Kiowa | 0.0 /100 | #326 | Tragic $34,074 |