Immigrants from Cambodia vs Immigrants from Poland No Vehicles in Household

COMPARE

Immigrants from Cambodia
Race
Ancestry
AfghanAfricanAlaska NativeAlaskan AthabascanAlbanianAleutAlsatianAmericanApacheArabArapahoArgentineanArmenianAssyrian/Chaldean/SyriacAustralianAustrianBahamianBangladeshiBarbadianBasqueBelgianBelizeanBermudanBhutaneseBlackfeetBolivianBrazilianBritishBritish West IndianBulgarianBurmeseCajunCambodianCanadianCape VerdeanCarpatho RusynCelticCentral AmericanCentral American IndianCherokeeCheyenneChickasawChileanChineseChippewaChoctawColombianColvilleComancheCosta RicanCreeCreekCroatianCrowCubanCypriotCzechCzechoslovakianDanishDelawareDominicanDutchDutch West IndianEastern EuropeanEcuadorianEgyptianEnglishEstonianEthiopianEuropeanFijianFilipinoFinnishFrenchFrench American IndianFrench CanadianGermanGerman RussianGhanaianGreekGuamanian/ChamorroGuatemalanGuyaneseHaitianHmongHonduranHopiHoumaHungarianIcelanderIndian (Asian)IndonesianInupiatIranianIraqiIrishIroquoisIsraeliItalianJamaicanJapaneseJordanianKenyanKiowaKoreanLaotianLatvianLebaneseLiberianLithuanianLumbeeLuxembourgerMacedonianMalaysianMalteseMarshalleseMenomineeMexicanMexican American IndianMongolianMoroccanNative HawaiianNavajoNepaleseNew ZealanderNicaraguanNigerianNorthern EuropeanNorwegianOkinawanOsageOttawaPaiutePakistaniPalestinianPanamanianParaguayanPennsylvania GermanPeruvianPimaPolishPortuguesePotawatomiPuebloPuerto RicanPuget Sound SalishRomanianRussianSalvadoranSamoanScandinavianScotch-IrishScottishSeminoleSenegaleseSerbianShoshoneSierra LeoneanSiouxSlavicSlovakSloveneSomaliSouth AfricanSouth AmericanSouth American IndianSoviet UnionSpaniardSpanishSpanish AmericanSpanish American IndianSri LankanSubsaharan AfricanSudaneseSwedishSwissSyrianTaiwaneseThaiTlingit-HaidaTohono O'OdhamTonganTrinidadian and TobagonianTsimshianTurkishU.S. Virgin IslanderUgandanUkrainianUruguayanUteVenezuelanVietnameseWelshWest IndianYakamaYaquiYugoslavianYumanYup'ikZimbabwean
Immigration
NonimmigrantsImmigrantsAfghanistanAfricaAlbaniaArgentinaArmeniaAsiaAustraliaAustriaBahamasBangladeshBarbadosBelarusBelgiumBelizeBoliviaBosnia and HerzegovinaBrazilBulgariaBurma/MyanmarCabo VerdeCambodiaCameroonCanadaCaribbeanCentral AmericaChileChinaColombiaCongoCosta RicaCroatiaCubaCzechoslovakiaDenmarkDominicaDominican RepublicEastern AfricaEastern AsiaEastern EuropeEcuadorEgyptEl SalvadorEnglandEritreaEthiopiaEuropeFijiFranceGermanyGhanaGreeceGrenadaGuatemalaGuyanaHaitiHondurasHong KongHungaryIndiaIndonesiaIranIraqIrelandIsraelItalyJamaicaJapanJordanKazakhstanKenyaKoreaKuwaitLaosLatin AmericaLatviaLebanonLiberiaLithuaniaMalaysiaMexicoMicronesiaMiddle AfricaMoldovaMoroccoNepalNetherlandsNicaraguaNigeriaNorth AmericaNorth MacedoniaNorthern AfricaNorthern EuropeNorwayOceaniaPakistanPanamaPeruPhilippinesPortugalRomaniaRussiaSaudi ArabiaScotlandSenegalSerbiaSierra LeoneSingaporeSomaliaSouth AfricaSouth AmericaSouth Central AsiaSouth Eastern AsiaSouthern EuropeSpainSri LankaSt. Vincent and the GrenadinesSudanSwedenSwitzerlandSyriaTaiwanThailandTrinidad and TobagoTurkeyUgandaUkraineUruguayUzbekistanVenezuelaVietnamWest IndiesWestern AfricaWestern AsiaWestern EuropeYemenZaireZimbabweAzores
Immigrants from Poland
Race
Ancestry
AfghanAfricanAlaska NativeAlaskan AthabascanAlbanianAleutAlsatianAmericanApacheArabArapahoArgentineanArmenianAssyrian/Chaldean/SyriacAustralianAustrianBahamianBangladeshiBarbadianBasqueBelgianBelizeanBermudanBhutaneseBlackfeetBolivianBrazilianBritishBritish West IndianBulgarianBurmeseCajunCambodianCanadianCape VerdeanCarpatho RusynCelticCentral AmericanCentral American IndianCherokeeCheyenneChickasawChileanChineseChippewaChoctawColombianColvilleComancheCosta RicanCreeCreekCroatianCrowCubanCypriotCzechCzechoslovakianDanishDelawareDominicanDutchDutch West IndianEastern EuropeanEcuadorianEgyptianEnglishEstonianEthiopianEuropeanFijianFilipinoFinnishFrenchFrench American IndianFrench CanadianGermanGerman RussianGhanaianGreekGuamanian/ChamorroGuatemalanGuyaneseHaitianHmongHonduranHopiHoumaHungarianIcelanderIndian (Asian)IndonesianInupiatIranianIraqiIrishIroquoisIsraeliItalianJamaicanJapaneseJordanianKenyanKiowaKoreanLaotianLatvianLebaneseLiberianLithuanianLumbeeLuxembourgerMacedonianMalaysianMalteseMarshalleseMenomineeMexicanMexican American IndianMongolianMoroccanNative HawaiianNavajoNepaleseNew ZealanderNicaraguanNigerianNorthern EuropeanNorwegianOkinawanOsageOttawaPaiutePakistaniPalestinianPanamanianParaguayanPennsylvania GermanPeruvianPimaPolishPortuguesePotawatomiPuebloPuerto RicanPuget Sound SalishRomanianRussianSalvadoranSamoanScandinavianScotch-IrishScottishSeminoleSenegaleseSerbianShoshoneSierra LeoneanSiouxSlavicSlovakSloveneSomaliSouth AfricanSouth AmericanSouth American IndianSoviet UnionSpaniardSpanishSpanish AmericanSpanish American IndianSri LankanSubsaharan AfricanSudaneseSwedishSwissSyrianTaiwaneseThaiTlingit-HaidaTohono O'OdhamTonganTrinidadian and TobagonianTsimshianTurkishU.S. Virgin IslanderUgandanUkrainianUruguayanUteVenezuelanVietnameseWelshWest IndianYakamaYaquiYugoslavianYumanYup'ikZimbabwean
Immigration
NonimmigrantsImmigrantsAfghanistanAfricaAlbaniaArgentinaArmeniaAsiaAustraliaAustriaBahamasBangladeshBarbadosBelarusBelgiumBelizeBoliviaBosnia and HerzegovinaBrazilBulgariaBurma/MyanmarCabo VerdeCameroonCanadaCaribbeanCentral AmericaChileChinaColombiaCongoCosta RicaCroatiaCubaCzechoslovakiaDenmarkDominicaDominican RepublicEastern AfricaEastern AsiaEastern EuropeEcuadorEgyptEl SalvadorEnglandEritreaEthiopiaEuropeFijiFranceGermanyGhanaGreeceGrenadaGuatemalaGuyanaHaitiHondurasHong KongHungaryIndiaIndonesiaIranIraqIrelandIsraelItalyJamaicaJapanJordanKazakhstanKenyaKoreaKuwaitLaosLatin AmericaLatviaLebanonLiberiaLithuaniaMalaysiaMexicoMicronesiaMiddle AfricaMoldovaMoroccoNepalNetherlandsNicaraguaNigeriaNorth AmericaNorth MacedoniaNorthern AfricaNorthern EuropeNorwayOceaniaPakistanPanamaPeruPhilippinesPolandPortugalRomaniaRussiaSaudi ArabiaScotlandSenegalSerbiaSierra LeoneSingaporeSomaliaSouth AfricaSouth AmericaSouth Central AsiaSouth Eastern AsiaSouthern EuropeSpainSri LankaSt. Vincent and the GrenadinesSudanSwedenSwitzerlandSyriaTaiwanThailandTrinidad and TobagoTurkeyUgandaUkraineUruguayUzbekistanVenezuelaVietnamWest IndiesWestern AfricaWestern AsiaWestern EuropeYemenZaireZimbabweAzores
No Vehicles in Household
Income
Poverty
Unemployment
Labor Participation
Family Structure
Vehicle Availability
Education Level
Disability

No Vehicles in Household Comparison

Immigrants from Cambodia

Immigrants from Poland

Good
Fair
10.2%
NO VEHICLES IN HOUSEHOLD
63.7/ 100
METRIC RATING
163rd/ 347
METRIC RANK
10.6%
NO VEHICLES IN HOUSEHOLD
38.4/ 100
METRIC RATING
187th/ 347
METRIC RANK

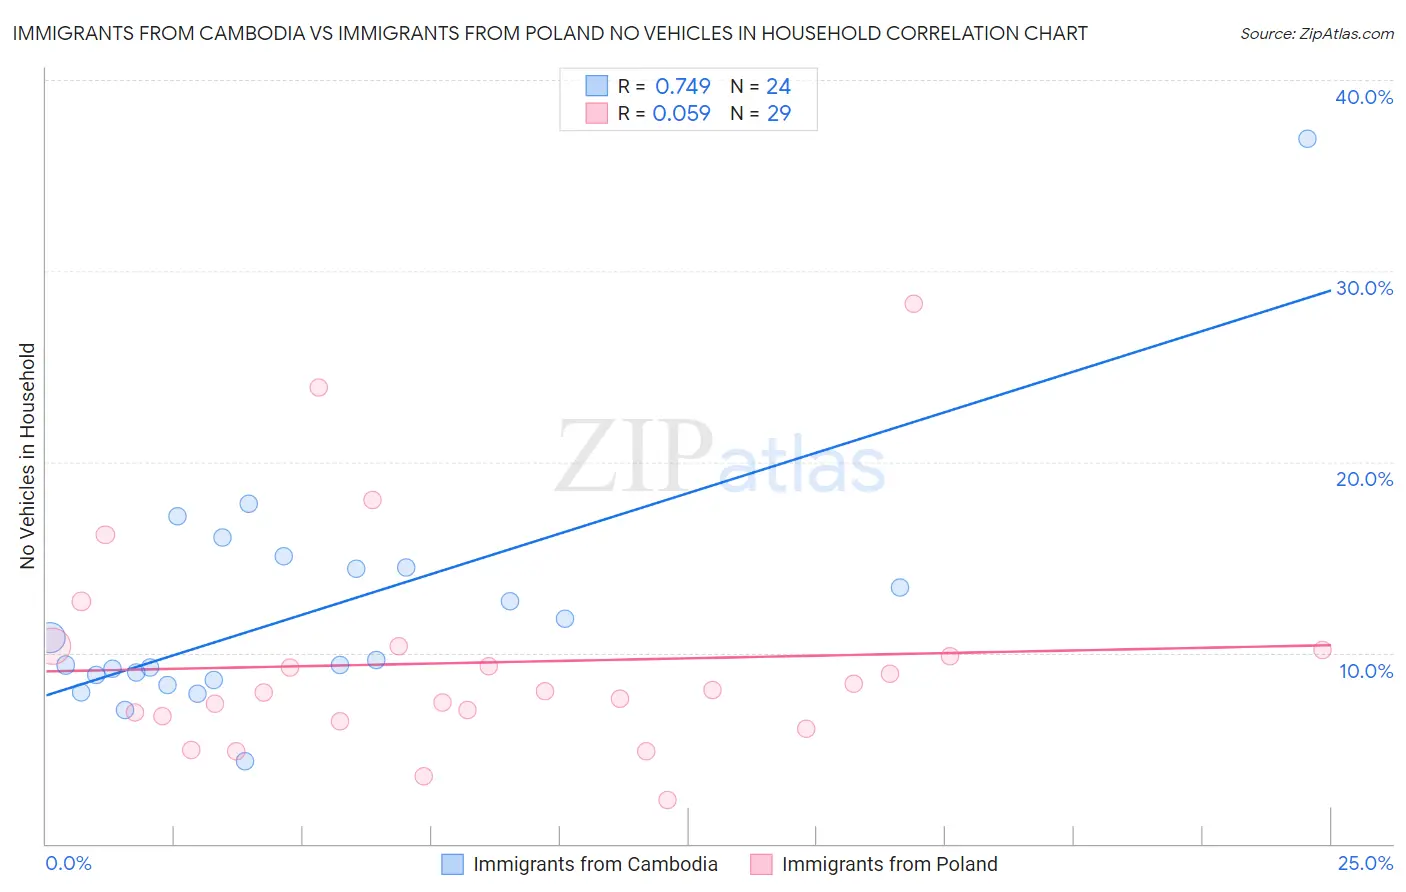
Immigrants from Cambodia vs Immigrants from Poland No Vehicles in Household Correlation Chart

The statistical analysis conducted on geographies consisting of 205,038,606 people shows a strong positive correlation between the proportion of Immigrants from Cambodia and percentage of households with no vehicle available in the United States with a correlation coefficient (R) of 0.749 and weighted average of 10.2%. Similarly, the statistical analysis conducted on geographies consisting of 304,302,908 people shows a slight positive correlation between the proportion of Immigrants from Poland and percentage of households with no vehicle available in the United States with a correlation coefficient (R) of 0.059 and weighted average of 10.6%, a difference of 3.6%.
Immigrants from Cambodia vs Immigrants from Poland No Vehicles in Household

No Vehicles in Household Correlation Summary

MeasurementImmigrants from CambodiaImmigrants from Poland
Minimum4.3%2.3%
Maximum36.9%28.3%
Range32.6%26.0%
Mean12.0%9.5%
Median9.5%8.0%
Interquartile 25% (IQ1)8.7%6.5%
Interquartile 75% (IQ3)14.4%10.2%
Interquartile Range (IQR)5.7%3.7%
Standard Deviation (Sample)6.3%5.7%
Standard Deviation (Population)6.2%5.6%

Similar Demographics by No Vehicles in Household

Demographics Similar to Immigrants from Cambodia by No Vehicles in Household

In terms of no vehicles in household, the demographic groups most similar to Immigrants from Cambodia are Immigrants from Austria (10.2%, a difference of 0.11%), New Zealander (10.2%, a difference of 0.21%), Immigrants from Middle Africa (10.2%, a difference of 0.31%), South African (10.2%, a difference of 0.37%), and Comanche (10.2%, a difference of 0.42%).
DemographicsRating | RankNo Vehicles in Household
Immigrants | Micronesia
70.9
/100
|
#156
Good
10.1%
Australians
70.6
/100
|
#157
Good
10.1%
Spanish American Indians
70.2
/100
|
#158
Good
10.1%
Immigrants | Indonesia
69.3
/100
|
#159
Good
10.1%
Immigrants | Middle Africa
65.7
/100
|
#160
Good
10.2%
New Zealanders
65.1
/100
|
#161
Good
10.2%
Immigrants | Austria
64.4
/100
|
#162
Good
10.2%
Immigrants | Cambodia
63.7
/100
|
#163
Good
10.2%
South Africans
61.1
/100
|
#164
Good
10.2%
Comanche
60.8
/100
|
#165
Good
10.2%
Immigrants | Costa Rica
60.5
/100
|
#166
Good
10.3%
Immigrants | Saudi Arabia
58.8
/100
|
#167
Average
10.3%
Indonesians
56.7
/100
|
#168
Average
10.3%
Lumbee
54.7
/100
|
#169
Average
10.3%
Immigrants | Latin America
53.2
/100
|
#170
Average
10.4%

Demographics Similar to Immigrants from Poland by No Vehicles in Household

In terms of no vehicles in household, the demographic groups most similar to Immigrants from Poland are Immigrants from Armenia (10.6%, a difference of 0.12%), Immigrants from Eritrea (10.6%, a difference of 0.30%), German Russian (10.5%, a difference of 0.31%), South American (10.5%, a difference of 0.49%), and Immigrants from North Macedonia (10.6%, a difference of 0.54%).
DemographicsRating | RankNo Vehicles in Household
Arabs
45.3
/100
|
#180
Average
10.5%
Immigrants | Colombia
44.1
/100
|
#181
Average
10.5%
Immigrants | Bulgaria
43.8
/100
|
#182
Average
10.5%
Natives/Alaskans
43.7
/100
|
#183
Average
10.5%
Immigrants | Nepal
42.4
/100
|
#184
Average
10.5%
South Americans
41.9
/100
|
#185
Average
10.5%
German Russians
40.6
/100
|
#186
Average
10.5%
Immigrants | Poland
38.4
/100
|
#187
Fair
10.6%
Immigrants | Armenia
37.5
/100
|
#188
Fair
10.6%
Immigrants | Eritrea
36.3
/100
|
#189
Fair
10.6%
Immigrants | North Macedonia
34.6
/100
|
#190
Fair
10.6%
Immigrants | Northern Europe
33.1
/100
|
#191
Fair
10.7%
Carpatho Rusyns
32.1
/100
|
#192
Fair
10.7%
Ukrainians
28.0
/100
|
#193
Fair
10.7%
Pueblo
27.0
/100
|
#194
Fair
10.8%