Panamanian vs Immigrants from Albania No Vehicles in Household
COMPARE
Panamanian
Immigrants from Albania
No Vehicles in Household
No Vehicles in Household Comparison
Panamanians
Immigrants from Albania
12.5%
NO VEHICLES IN HOUSEHOLD
0.2/ 100
METRIC RATING
269th/ 347
METRIC RANK
13.0%
NO VEHICLES IN HOUSEHOLD
0.1/ 100
METRIC RATING
275th/ 347
METRIC RANK
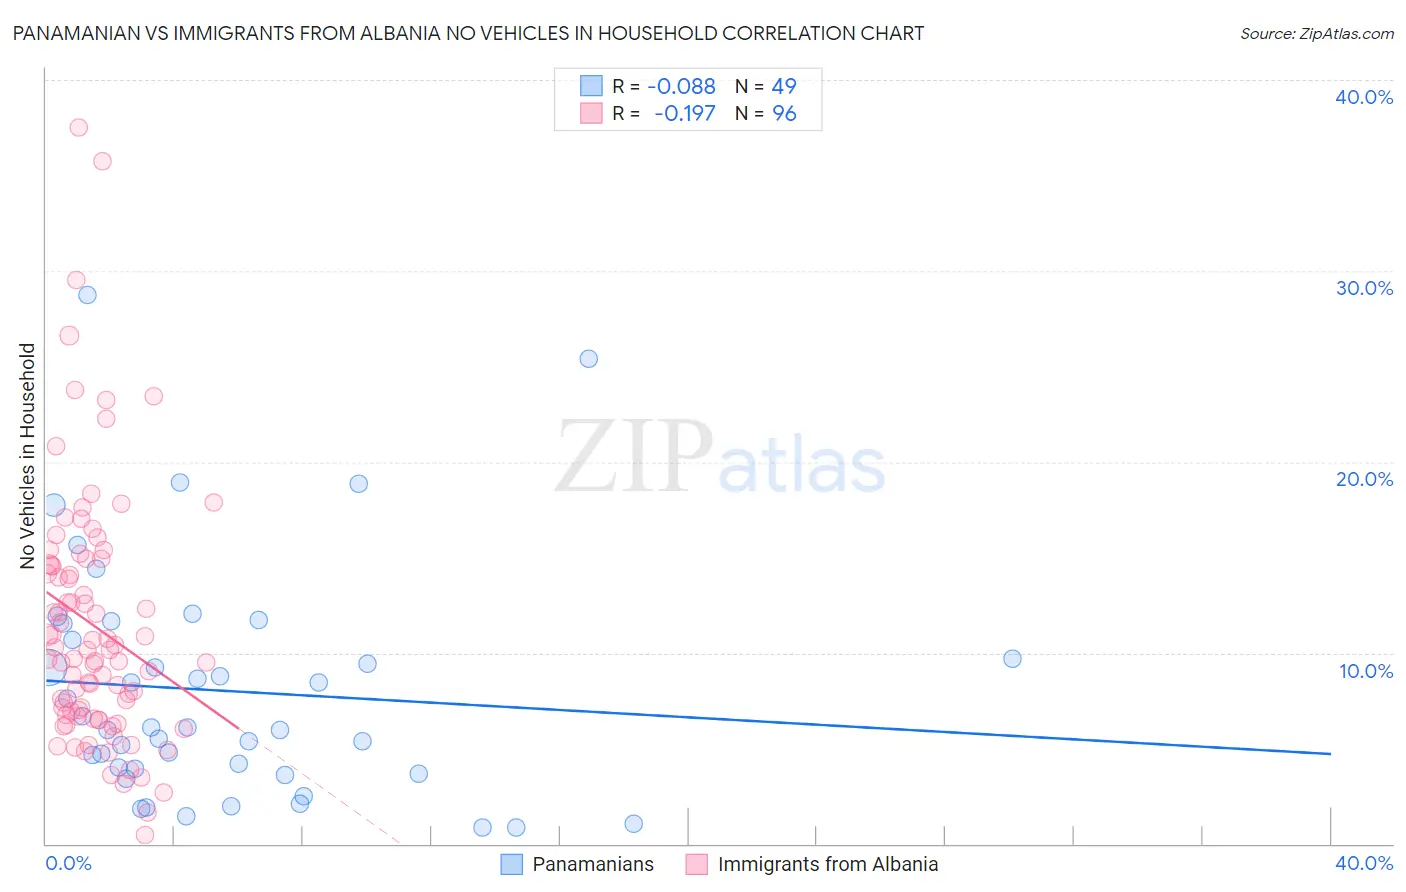
Panamanian vs Immigrants from Albania No Vehicles in Household Correlation Chart
The statistical analysis conducted on geographies consisting of 280,874,828 people shows a slight negative correlation between the proportion of Panamanians and percentage of households with no vehicle available in the United States with a correlation coefficient (R) of -0.088 and weighted average of 12.5%. Similarly, the statistical analysis conducted on geographies consisting of 107,605,930 people shows a poor negative correlation between the proportion of Immigrants from Albania and percentage of households with no vehicle available in the United States with a correlation coefficient (R) of -0.197 and weighted average of 13.0%, a difference of 3.5%.
No Vehicles in Household Correlation Summary
| Measurement | Panamanian | Immigrants from Albania |
| Minimum | 0.82% | 0.48% |
| Maximum | 28.8% | 37.5% |
| Range | 27.9% | 37.0% |
| Mean | 8.0% | 11.4% |
| Median | 6.1% | 9.9% |
| Interquartile 25% (IQ1) | 3.8% | 6.7% |
| Interquartile 75% (IQ3) | 11.1% | 14.6% |
| Interquartile Range (IQR) | 7.3% | 7.9% |
| Standard Deviation (Sample) | 6.1% | 6.7% |
| Standard Deviation (Population) | 6.1% | 6.7% |
Demographics Similar to Panamanians and Immigrants from Albania by No Vehicles in Household
In terms of no vehicles in household, the demographic groups most similar to Panamanians are Immigrants from Africa (12.5%, a difference of 0.13%), Immigrants from Europe (12.5%, a difference of 0.18%), Immigrants from Northern Africa (12.6%, a difference of 0.55%), Immigrants from Morocco (12.6%, a difference of 0.67%), and Israeli (12.4%, a difference of 0.76%). Similarly, the demographic groups most similar to Immigrants from Albania are Immigrants from Singapore (12.9%, a difference of 0.18%), Immigrants from France (12.9%, a difference of 0.22%), Immigrants from Southern Europe (13.0%, a difference of 0.36%), Aleut (13.0%, a difference of 0.44%), and Immigrants from Croatia (13.0%, a difference of 0.48%).
| Demographics | Rating | Rank | No Vehicles in Household |
| Immigrants | Liberia | 0.6 /100 | #262 | Tragic 12.2% |
| Immigrants | Egypt | 0.6 /100 | #263 | Tragic 12.2% |
| Immigrants | Switzerland | 0.5 /100 | #264 | Tragic 12.3% |
| Africans | 0.4 /100 | #265 | Tragic 12.3% |
| Israelis | 0.3 /100 | #266 | Tragic 12.4% |
| Immigrants | Europe | 0.3 /100 | #267 | Tragic 12.5% |
| Immigrants | Africa | 0.2 /100 | #268 | Tragic 12.5% |
| Panamanians | 0.2 /100 | #269 | Tragic 12.5% |
| Immigrants | Northern Africa | 0.2 /100 | #270 | Tragic 12.6% |
| Immigrants | Morocco | 0.2 /100 | #271 | Tragic 12.6% |
| Bermudans | 0.1 /100 | #272 | Tragic 12.8% |
| Immigrants | France | 0.1 /100 | #273 | Tragic 12.9% |
| Immigrants | Singapore | 0.1 /100 | #274 | Tragic 12.9% |
| Immigrants | Albania | 0.1 /100 | #275 | Tragic 13.0% |
| Immigrants | Southern Europe | 0.1 /100 | #276 | Tragic 13.0% |
| Aleuts | 0.1 /100 | #277 | Tragic 13.0% |
| Immigrants | Croatia | 0.1 /100 | #278 | Tragic 13.0% |
| Mongolians | 0.0 /100 | #279 | Tragic 13.1% |
| Alsatians | 0.0 /100 | #280 | Tragic 13.2% |
| Central American Indians | 0.0 /100 | #281 | Tragic 13.3% |
| Immigrants | Eastern Asia | 0.0 /100 | #282 | Tragic 13.5% |