Paiute vs Immigrants from Cabo Verde Family Households with Children
COMPARE
Paiute
Immigrants from Cabo Verde
Family Households with Children
Family Households with Children Comparison
Paiute
Immigrants from Cabo Verde
26.4%
FAMILY HOUSEHOLDS WITH CHILDREN
0.1/ 100
METRIC RATING
300th/ 347
METRIC RANK
27.6%
FAMILY HOUSEHOLDS WITH CHILDREN
75.6/ 100
METRIC RATING
153rd/ 347
METRIC RANK
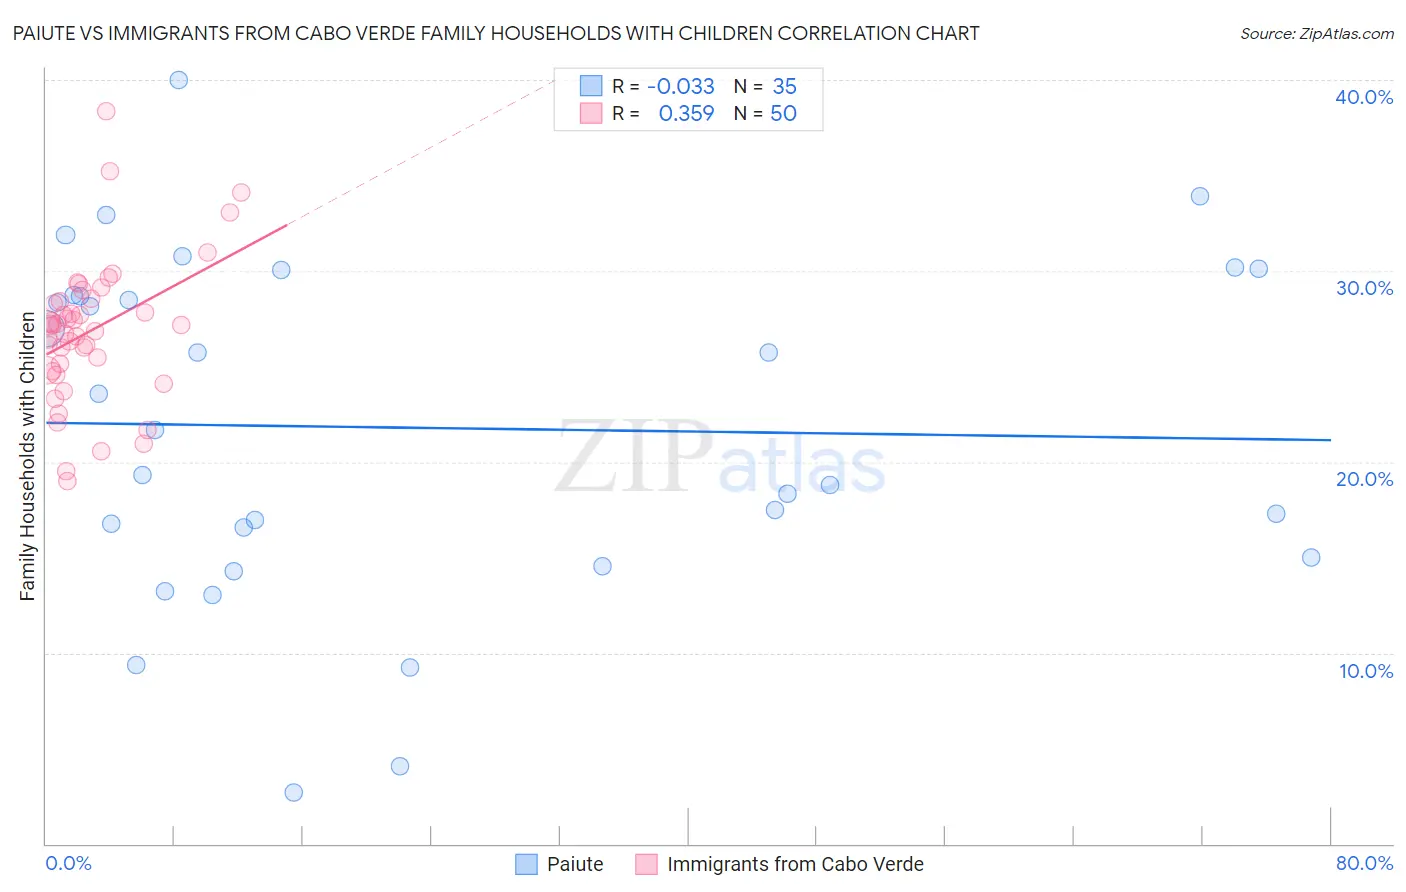
Paiute vs Immigrants from Cabo Verde Family Households with Children Correlation Chart
The statistical analysis conducted on geographies consisting of 58,389,869 people shows no correlation between the proportion of Paiute and percentage of family households with children in the United States with a correlation coefficient (R) of -0.033 and weighted average of 26.4%. Similarly, the statistical analysis conducted on geographies consisting of 38,129,777 people shows a mild positive correlation between the proportion of Immigrants from Cabo Verde and percentage of family households with children in the United States with a correlation coefficient (R) of 0.359 and weighted average of 27.6%, a difference of 4.8%.
Family Households with Children Correlation Summary
| Measurement | Paiute | Immigrants from Cabo Verde |
| Minimum | 2.7% | 19.0% |
| Maximum | 40.0% | 38.4% |
| Range | 37.3% | 19.4% |
| Mean | 21.8% | 26.8% |
| Median | 21.6% | 27.1% |
| Interquartile 25% (IQ1) | 15.0% | 24.8% |
| Interquartile 75% (IQ3) | 28.7% | 28.4% |
| Interquartile Range (IQR) | 13.8% | 3.6% |
| Standard Deviation (Sample) | 8.9% | 3.7% |
| Standard Deviation (Population) | 8.8% | 3.7% |
Similar Demographics by Family Households with Children
Demographics Similar to Paiute by Family Households with Children
In terms of family households with children, the demographic groups most similar to Paiute are Immigrants from Trinidad and Tobago (26.4%, a difference of 0.020%), Serbian (26.4%, a difference of 0.030%), Immigrants from Guyana (26.3%, a difference of 0.060%), Immigrants from Bahamas (26.3%, a difference of 0.11%), and Trinidadian and Tobagonian (26.4%, a difference of 0.12%).
| Demographics | Rating | Rank | Family Households with Children |
| Blacks/African Americans | 0.1 /100 | #293 | Tragic 26.5% |
| Latvians | 0.1 /100 | #294 | Tragic 26.4% |
| Macedonians | 0.1 /100 | #295 | Tragic 26.4% |
| Croatians | 0.1 /100 | #296 | Tragic 26.4% |
| Armenians | 0.1 /100 | #297 | Tragic 26.4% |
| Immigrants | Western Europe | 0.1 /100 | #298 | Tragic 26.4% |
| Trinidadians and Tobagonians | 0.1 /100 | #299 | Tragic 26.4% |
| Paiute | 0.1 /100 | #300 | Tragic 26.4% |
| Immigrants | Trinidad and Tobago | 0.1 /100 | #301 | Tragic 26.4% |
| Serbians | 0.1 /100 | #302 | Tragic 26.4% |
| Immigrants | Guyana | 0.1 /100 | #303 | Tragic 26.3% |
| Immigrants | Bahamas | 0.1 /100 | #304 | Tragic 26.3% |
| Guyanese | 0.1 /100 | #305 | Tragic 26.3% |
| Bermudans | 0.1 /100 | #306 | Tragic 26.3% |
| West Indians | 0.0 /100 | #307 | Tragic 26.3% |
Demographics Similar to Immigrants from Cabo Verde by Family Households with Children
In terms of family households with children, the demographic groups most similar to Immigrants from Cabo Verde are Icelander (27.6%, a difference of 0.010%), Comanche (27.6%, a difference of 0.020%), Hungarian (27.6%, a difference of 0.030%), Ethiopian (27.6%, a difference of 0.040%), and Portuguese (27.6%, a difference of 0.070%).
| Demographics | Rating | Rank | Family Households with Children |
| Basques | 79.5 /100 | #146 | Good 27.7% |
| Immigrants | Moldova | 79.1 /100 | #147 | Good 27.6% |
| Osage | 79.0 /100 | #148 | Good 27.6% |
| Menominee | 78.9 /100 | #149 | Good 27.6% |
| Argentineans | 78.5 /100 | #150 | Good 27.6% |
| Portuguese | 77.8 /100 | #151 | Good 27.6% |
| Ethiopians | 77.0 /100 | #152 | Good 27.6% |
| Immigrants | Cabo Verde | 75.6 /100 | #153 | Good 27.6% |
| Icelanders | 75.3 /100 | #154 | Good 27.6% |
| Comanche | 74.8 /100 | #155 | Good 27.6% |
| Hungarians | 74.6 /100 | #156 | Good 27.6% |
| Indians (Asian) | 71.6 /100 | #157 | Good 27.6% |
| Romanians | 70.8 /100 | #158 | Good 27.6% |
| Mongolians | 70.7 /100 | #159 | Good 27.6% |
| Sub-Saharan Africans | 67.5 /100 | #160 | Good 27.6% |