Nicaraguan vs Vietnamese Seniors Poverty Over the Age of 75
COMPARE
Nicaraguan
Vietnamese
Seniors Poverty Over the Age of 75
Seniors Poverty Over the Age of 75 Comparison
Nicaraguans
Vietnamese
16.6%
SENIORS POVERTY OVER THE AGE OF 75
0.0/ 100
METRIC RATING
325th/ 347
METRIC RANK
15.9%
SENIORS POVERTY OVER THE AGE OF 75
0.0/ 100
METRIC RATING
310th/ 347
METRIC RANK
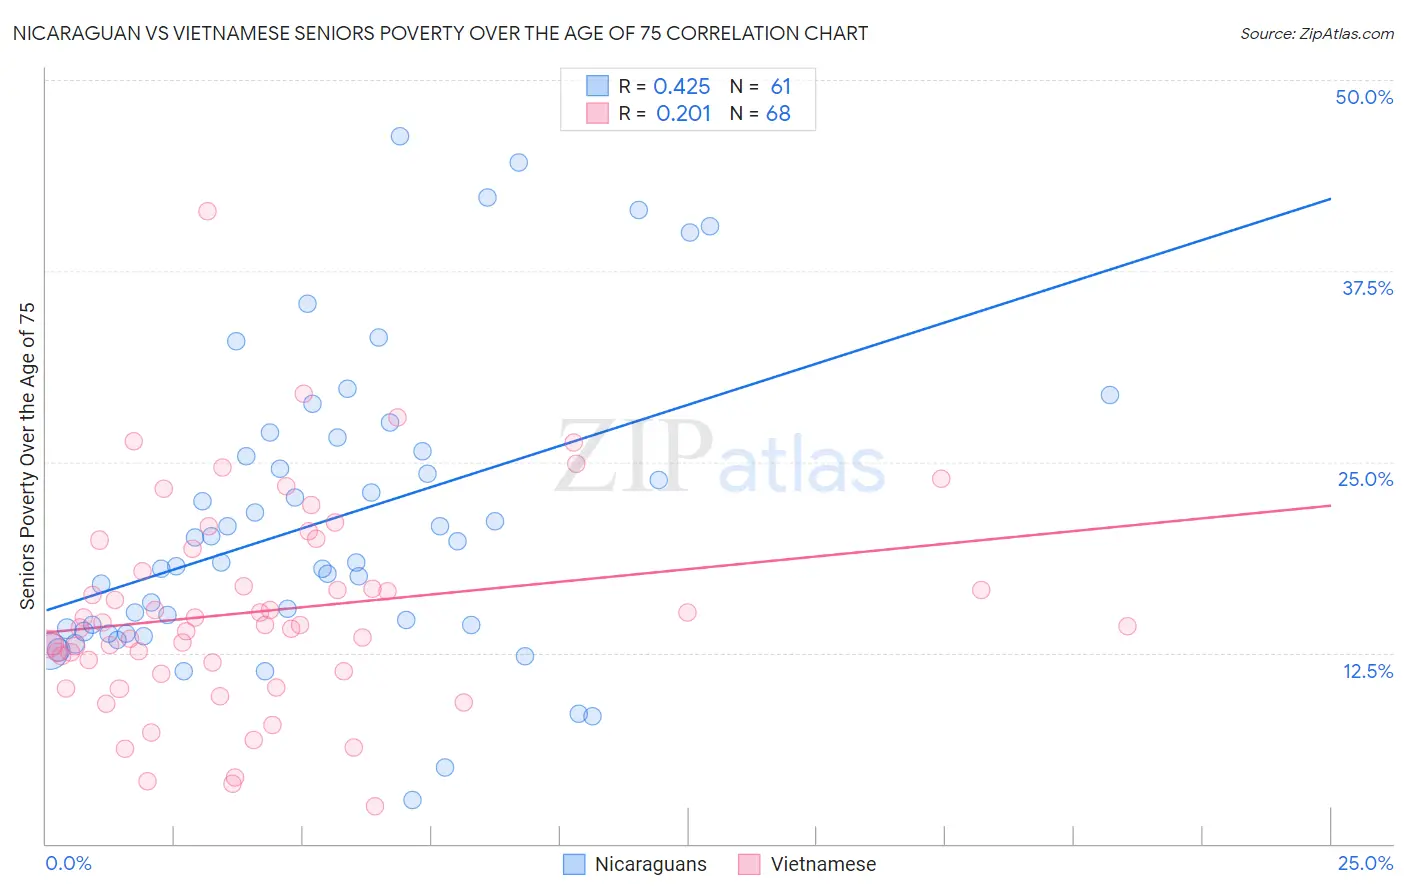
Nicaraguan vs Vietnamese Seniors Poverty Over the Age of 75 Correlation Chart
The statistical analysis conducted on geographies consisting of 283,995,747 people shows a moderate positive correlation between the proportion of Nicaraguans and poverty level among seniors over the age of 75 in the United States with a correlation coefficient (R) of 0.425 and weighted average of 16.6%. Similarly, the statistical analysis conducted on geographies consisting of 169,621,093 people shows a weak positive correlation between the proportion of Vietnamese and poverty level among seniors over the age of 75 in the United States with a correlation coefficient (R) of 0.201 and weighted average of 15.9%, a difference of 4.7%.
Seniors Poverty Over the Age of 75 Correlation Summary
| Measurement | Nicaraguan | Vietnamese |
| Minimum | 2.9% | 2.5% |
| Maximum | 46.3% | 41.4% |
| Range | 43.4% | 38.9% |
| Mean | 21.1% | 15.2% |
| Median | 18.4% | 14.3% |
| Interquartile 25% (IQ1) | 14.0% | 11.5% |
| Interquartile 75% (IQ3) | 26.2% | 18.6% |
| Interquartile Range (IQR) | 12.2% | 7.0% |
| Standard Deviation (Sample) | 9.8% | 6.8% |
| Standard Deviation (Population) | 9.7% | 6.7% |
Demographics Similar to Nicaraguans and Vietnamese by Seniors Poverty Over the Age of 75
In terms of seniors poverty over the age of 75, the demographic groups most similar to Nicaraguans are Immigrants from Uzbekistan (16.5%, a difference of 0.38%), Central American Indian (16.5%, a difference of 0.43%), Immigrants from Barbados (16.5%, a difference of 0.52%), Immigrants from Haiti (16.5%, a difference of 0.55%), and Pueblo (16.7%, a difference of 0.70%). Similarly, the demographic groups most similar to Vietnamese are Yup'ik (15.8%, a difference of 0.10%), Trinidadian and Tobagonian (15.9%, a difference of 0.10%), Immigrants from Bangladesh (15.8%, a difference of 0.40%), Immigrants from West Indies (15.8%, a difference of 0.44%), and Crow (15.9%, a difference of 0.51%).
| Demographics | Rating | Rank | Seniors Poverty Over the Age of 75 |
| Immigrants | West Indies | 0.0 /100 | #307 | Tragic 15.8% |
| Immigrants | Bangladesh | 0.0 /100 | #308 | Tragic 15.8% |
| Yup'ik | 0.0 /100 | #309 | Tragic 15.8% |
| Vietnamese | 0.0 /100 | #310 | Tragic 15.9% |
| Trinidadians and Tobagonians | 0.0 /100 | #311 | Tragic 15.9% |
| Crow | 0.0 /100 | #312 | Tragic 15.9% |
| Barbadians | 0.0 /100 | #313 | Tragic 16.0% |
| Tsimshian | 0.0 /100 | #314 | Tragic 16.1% |
| Guyanese | 0.0 /100 | #315 | Tragic 16.1% |
| Immigrants | Ecuador | 0.0 /100 | #316 | Tragic 16.1% |
| Immigrants | Guyana | 0.0 /100 | #317 | Tragic 16.2% |
| Houma | 0.0 /100 | #318 | Tragic 16.2% |
| Haitians | 0.0 /100 | #319 | Tragic 16.2% |
| Immigrants | Yemen | 0.0 /100 | #320 | Tragic 16.5% |
| Immigrants | Haiti | 0.0 /100 | #321 | Tragic 16.5% |
| Immigrants | Barbados | 0.0 /100 | #322 | Tragic 16.5% |
| Central American Indians | 0.0 /100 | #323 | Tragic 16.5% |
| Immigrants | Uzbekistan | 0.0 /100 | #324 | Tragic 16.5% |
| Nicaraguans | 0.0 /100 | #325 | Tragic 16.6% |
| Pueblo | 0.0 /100 | #326 | Tragic 16.7% |
| Sioux | 0.0 /100 | #327 | Tragic 16.8% |