Nicaraguan vs U.S. Virgin Islander No Vehicles in Household
COMPARE
Nicaraguan
U.S. Virgin Islander
No Vehicles in Household
No Vehicles in Household Comparison
Nicaraguans
U.S. Virgin Islanders
9.7%
NO VEHICLES IN HOUSEHOLD
89.5/ 100
METRIC RATING
129th/ 347
METRIC RANK
15.4%
NO VEHICLES IN HOUSEHOLD
0.0/ 100
METRIC RATING
308th/ 347
METRIC RANK
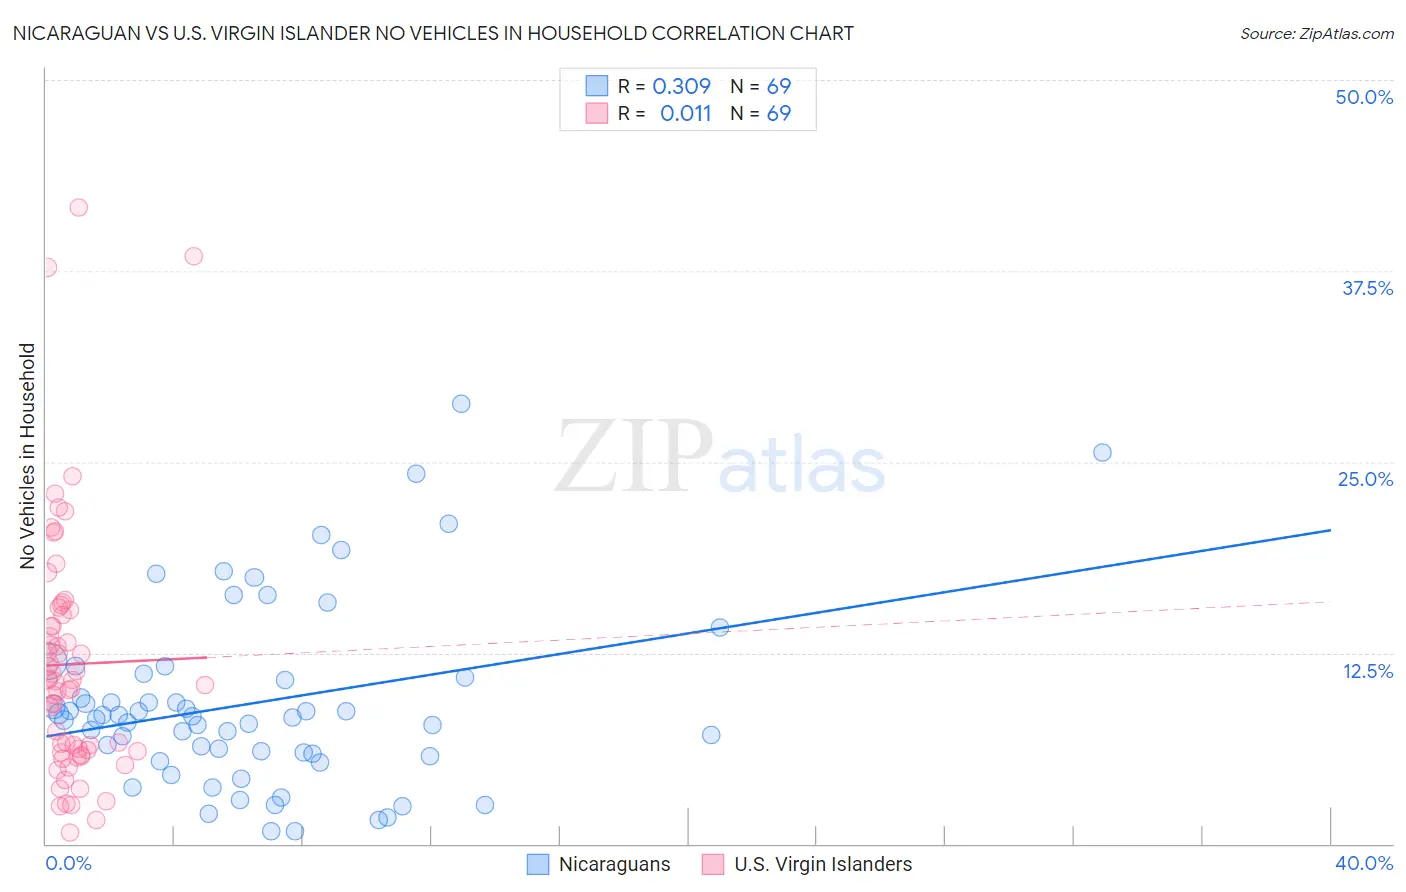
Nicaraguan vs U.S. Virgin Islander No Vehicles in Household Correlation Chart
The statistical analysis conducted on geographies consisting of 285,349,365 people shows a mild positive correlation between the proportion of Nicaraguans and percentage of households with no vehicle available in the United States with a correlation coefficient (R) of 0.309 and weighted average of 9.7%. Similarly, the statistical analysis conducted on geographies consisting of 87,426,886 people shows no correlation between the proportion of U.S. Virgin Islanders and percentage of households with no vehicle available in the United States with a correlation coefficient (R) of 0.011 and weighted average of 15.4%, a difference of 59.4%.
No Vehicles in Household Correlation Summary
| Measurement | Nicaraguan | U.S. Virgin Islander |
| Minimum | 0.83% | 0.71% |
| Maximum | 28.8% | 41.7% |
| Range | 27.9% | 41.0% |
| Mean | 9.2% | 11.7% |
| Median | 8.2% | 10.6% |
| Interquartile 25% (IQ1) | 5.8% | 6.0% |
| Interquartile 75% (IQ3) | 11.0% | 15.1% |
| Interquartile Range (IQR) | 5.2% | 9.1% |
| Standard Deviation (Sample) | 6.0% | 8.2% |
| Standard Deviation (Population) | 5.9% | 8.1% |
Similar Demographics by No Vehicles in Household
Demographics Similar to Nicaraguans by No Vehicles in Household
In terms of no vehicles in household, the demographic groups most similar to Nicaraguans are Immigrants from Syria (9.6%, a difference of 0.030%), Immigrants from Kenya (9.6%, a difference of 0.11%), Burmese (9.7%, a difference of 0.25%), Icelander (9.6%, a difference of 0.29%), and Immigrants from Cameroon (9.6%, a difference of 0.46%).
| Demographics | Rating | Rank | No Vehicles in Household |
| Costa Ricans | 92.3 /100 | #122 | Exceptional 9.5% |
| Blackfeet | 91.4 /100 | #123 | Exceptional 9.6% |
| Immigrants | Korea | 90.9 /100 | #124 | Exceptional 9.6% |
| Immigrants | Cameroon | 90.6 /100 | #125 | Exceptional 9.6% |
| Icelanders | 90.2 /100 | #126 | Exceptional 9.6% |
| Immigrants | Kenya | 89.7 /100 | #127 | Excellent 9.6% |
| Immigrants | Syria | 89.5 /100 | #128 | Excellent 9.6% |
| Nicaraguans | 89.5 /100 | #129 | Excellent 9.7% |
| Burmese | 88.8 /100 | #130 | Excellent 9.7% |
| Immigrants | Azores | 88.2 /100 | #131 | Excellent 9.7% |
| Kenyans | 88.0 /100 | #132 | Excellent 9.7% |
| Immigrants | Oceania | 87.1 /100 | #133 | Excellent 9.7% |
| Syrians | 87.1 /100 | #134 | Excellent 9.7% |
| Latvians | 85.1 /100 | #135 | Excellent 9.8% |
| Immigrants | South Africa | 85.0 /100 | #136 | Excellent 9.8% |
Demographics Similar to U.S. Virgin Islanders by No Vehicles in Household
In terms of no vehicles in household, the demographic groups most similar to U.S. Virgin Islanders are Immigrants from Haiti (15.4%, a difference of 0.030%), Immigrants from Belize (15.4%, a difference of 0.17%), Puerto Rican (15.5%, a difference of 0.65%), Cape Verdean (15.6%, a difference of 1.2%), and Immigrants from Israel (15.6%, a difference of 1.2%).
| Demographics | Rating | Rank | No Vehicles in Household |
| Immigrants | Ukraine | 0.0 /100 | #301 | Tragic 14.9% |
| Haitians | 0.0 /100 | #302 | Tragic 14.9% |
| Immigrants | Western Africa | 0.0 /100 | #303 | Tragic 15.0% |
| Immigrants | Russia | 0.0 /100 | #304 | Tragic 15.1% |
| Immigrants | China | 0.0 /100 | #305 | Tragic 15.2% |
| Immigrants | Belize | 0.0 /100 | #306 | Tragic 15.4% |
| Immigrants | Haiti | 0.0 /100 | #307 | Tragic 15.4% |
| U.S. Virgin Islanders | 0.0 /100 | #308 | Tragic 15.4% |
| Puerto Ricans | 0.0 /100 | #309 | Tragic 15.5% |
| Cape Verdeans | 0.0 /100 | #310 | Tragic 15.6% |
| Immigrants | Israel | 0.0 /100 | #311 | Tragic 15.6% |
| Alaskan Athabascans | 0.0 /100 | #312 | Tragic 15.6% |
| Tohono O'odham | 0.0 /100 | #313 | Tragic 15.6% |
| Albanians | 0.0 /100 | #314 | Tragic 15.6% |
| Cypriots | 0.0 /100 | #315 | Tragic 15.7% |