Immigrants from Fiji vs Immigrants from Kenya No Vehicles in Household
COMPARE
Immigrants from Fiji
Immigrants from Kenya
No Vehicles in Household
No Vehicles in Household Comparison
Immigrants from Fiji
Immigrants from Kenya
7.8%
NO VEHICLES IN HOUSEHOLD
99.9/ 100
METRIC RATING
39th/ 347
METRIC RANK
9.6%
NO VEHICLES IN HOUSEHOLD
89.7/ 100
METRIC RATING
127th/ 347
METRIC RANK
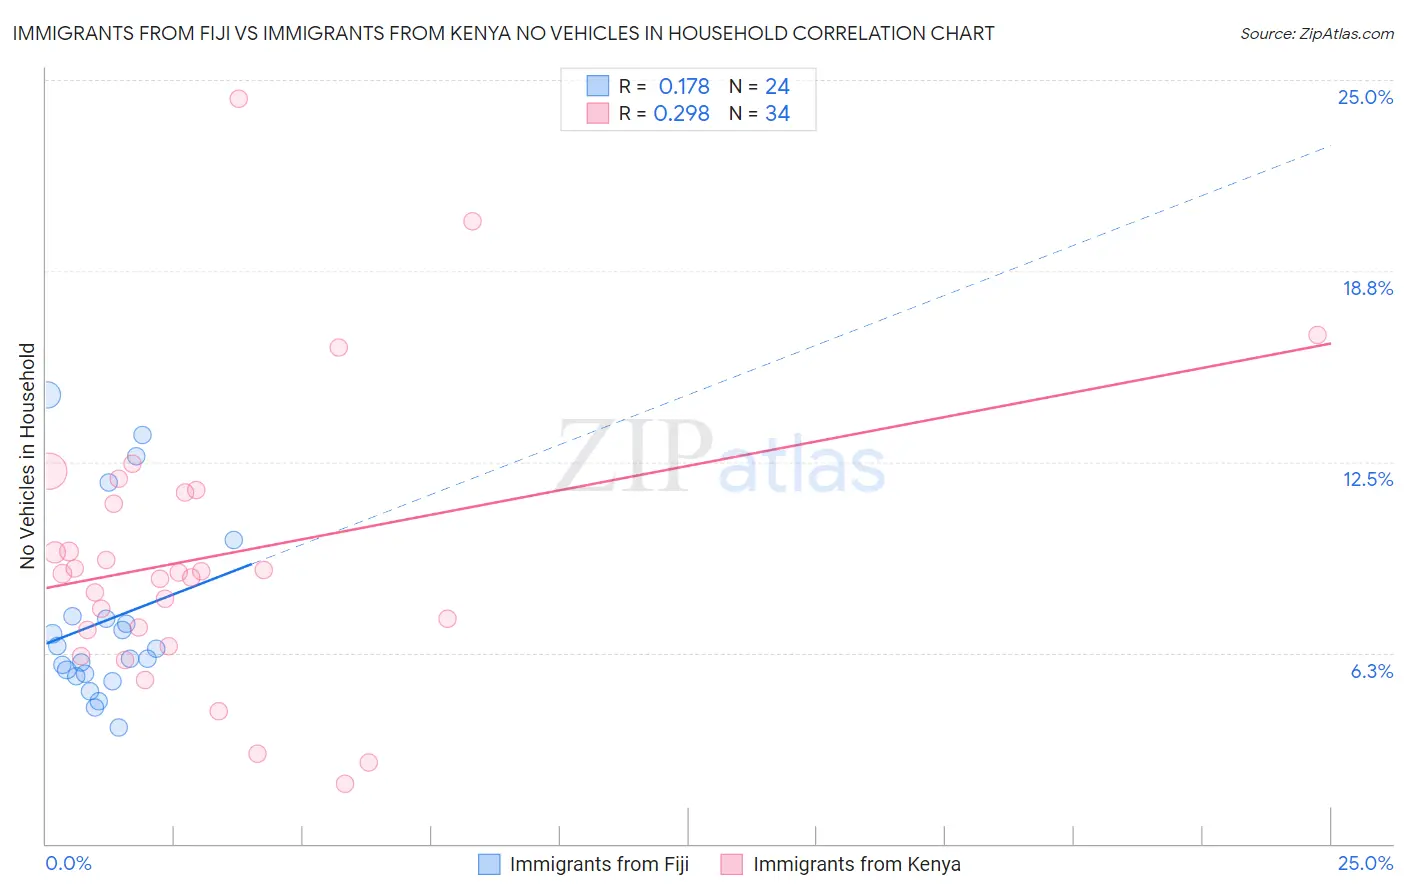
Immigrants from Fiji vs Immigrants from Kenya No Vehicles in Household Correlation Chart
The statistical analysis conducted on geographies consisting of 93,723,528 people shows a poor positive correlation between the proportion of Immigrants from Fiji and percentage of households with no vehicle available in the United States with a correlation coefficient (R) of 0.178 and weighted average of 7.8%. Similarly, the statistical analysis conducted on geographies consisting of 217,879,902 people shows a weak positive correlation between the proportion of Immigrants from Kenya and percentage of households with no vehicle available in the United States with a correlation coefficient (R) of 0.298 and weighted average of 9.6%, a difference of 23.2%.
No Vehicles in Household Correlation Summary
| Measurement | Immigrants from Fiji | Immigrants from Kenya |
| Minimum | 3.8% | 2.0% |
| Maximum | 14.7% | 24.4% |
| Range | 10.9% | 22.4% |
| Mean | 7.3% | 9.4% |
| Median | 6.2% | 8.9% |
| Interquartile 25% (IQ1) | 5.5% | 7.0% |
| Interquartile 75% (IQ3) | 7.4% | 11.5% |
| Interquartile Range (IQR) | 1.9% | 4.5% |
| Standard Deviation (Sample) | 3.0% | 4.7% |
| Standard Deviation (Population) | 2.9% | 4.6% |
Similar Demographics by No Vehicles in Household
Demographics Similar to Immigrants from Fiji by No Vehicles in Household
In terms of no vehicles in household, the demographic groups most similar to Immigrants from Fiji are Czechoslovakian (7.8%, a difference of 0.10%), French Canadian (7.8%, a difference of 0.24%), Swiss (7.9%, a difference of 0.38%), Chickasaw (7.9%, a difference of 0.46%), and Creek (7.8%, a difference of 0.58%).
| Demographics | Rating | Rank | No Vehicles in Household |
| Malaysians | 100.0 /100 | #32 | Exceptional 7.7% |
| Immigrants | Taiwan | 100.0 /100 | #33 | Exceptional 7.7% |
| Immigrants | Vietnam | 100.0 /100 | #34 | Exceptional 7.7% |
| Cherokee | 99.9 /100 | #35 | Exceptional 7.7% |
| Iraqis | 99.9 /100 | #36 | Exceptional 7.7% |
| Basques | 99.9 /100 | #37 | Exceptional 7.8% |
| Creek | 99.9 /100 | #38 | Exceptional 7.8% |
| Immigrants | Fiji | 99.9 /100 | #39 | Exceptional 7.8% |
| Czechoslovakians | 99.9 /100 | #40 | Exceptional 7.8% |
| French Canadians | 99.9 /100 | #41 | Exceptional 7.8% |
| Swiss | 99.9 /100 | #42 | Exceptional 7.9% |
| Chickasaw | 99.9 /100 | #43 | Exceptional 7.9% |
| Choctaw | 99.9 /100 | #44 | Exceptional 7.9% |
| Immigrants | Nonimmigrants | 99.9 /100 | #45 | Exceptional 7.9% |
| Spanish | 99.9 /100 | #46 | Exceptional 7.9% |
Demographics Similar to Immigrants from Kenya by No Vehicles in Household
In terms of no vehicles in household, the demographic groups most similar to Immigrants from Kenya are Immigrants from Syria (9.6%, a difference of 0.080%), Nicaraguan (9.7%, a difference of 0.11%), Icelander (9.6%, a difference of 0.18%), Immigrants from Cameroon (9.6%, a difference of 0.35%), and Burmese (9.7%, a difference of 0.36%).
| Demographics | Rating | Rank | No Vehicles in Household |
| Immigrants | Thailand | 92.6 /100 | #120 | Exceptional 9.5% |
| Puget Sound Salish | 92.4 /100 | #121 | Exceptional 9.5% |
| Costa Ricans | 92.3 /100 | #122 | Exceptional 9.5% |
| Blackfeet | 91.4 /100 | #123 | Exceptional 9.6% |
| Immigrants | Korea | 90.9 /100 | #124 | Exceptional 9.6% |
| Immigrants | Cameroon | 90.6 /100 | #125 | Exceptional 9.6% |
| Icelanders | 90.2 /100 | #126 | Exceptional 9.6% |
| Immigrants | Kenya | 89.7 /100 | #127 | Excellent 9.6% |
| Immigrants | Syria | 89.5 /100 | #128 | Excellent 9.6% |
| Nicaraguans | 89.5 /100 | #129 | Excellent 9.7% |
| Burmese | 88.8 /100 | #130 | Excellent 9.7% |
| Immigrants | Azores | 88.2 /100 | #131 | Excellent 9.7% |
| Kenyans | 88.0 /100 | #132 | Excellent 9.7% |
| Immigrants | Oceania | 87.1 /100 | #133 | Excellent 9.7% |
| Syrians | 87.1 /100 | #134 | Excellent 9.7% |