Mexican American Indian vs Blackfeet No Vehicles in Household
COMPARE
Mexican American Indian
Blackfeet
No Vehicles in Household
No Vehicles in Household Comparison
Mexican American Indians
Blackfeet
9.1%
NO VEHICLES IN HOUSEHOLD
97.6/ 100
METRIC RATING
108th/ 347
METRIC RANK
9.6%
NO VEHICLES IN HOUSEHOLD
91.4/ 100
METRIC RATING
123rd/ 347
METRIC RANK
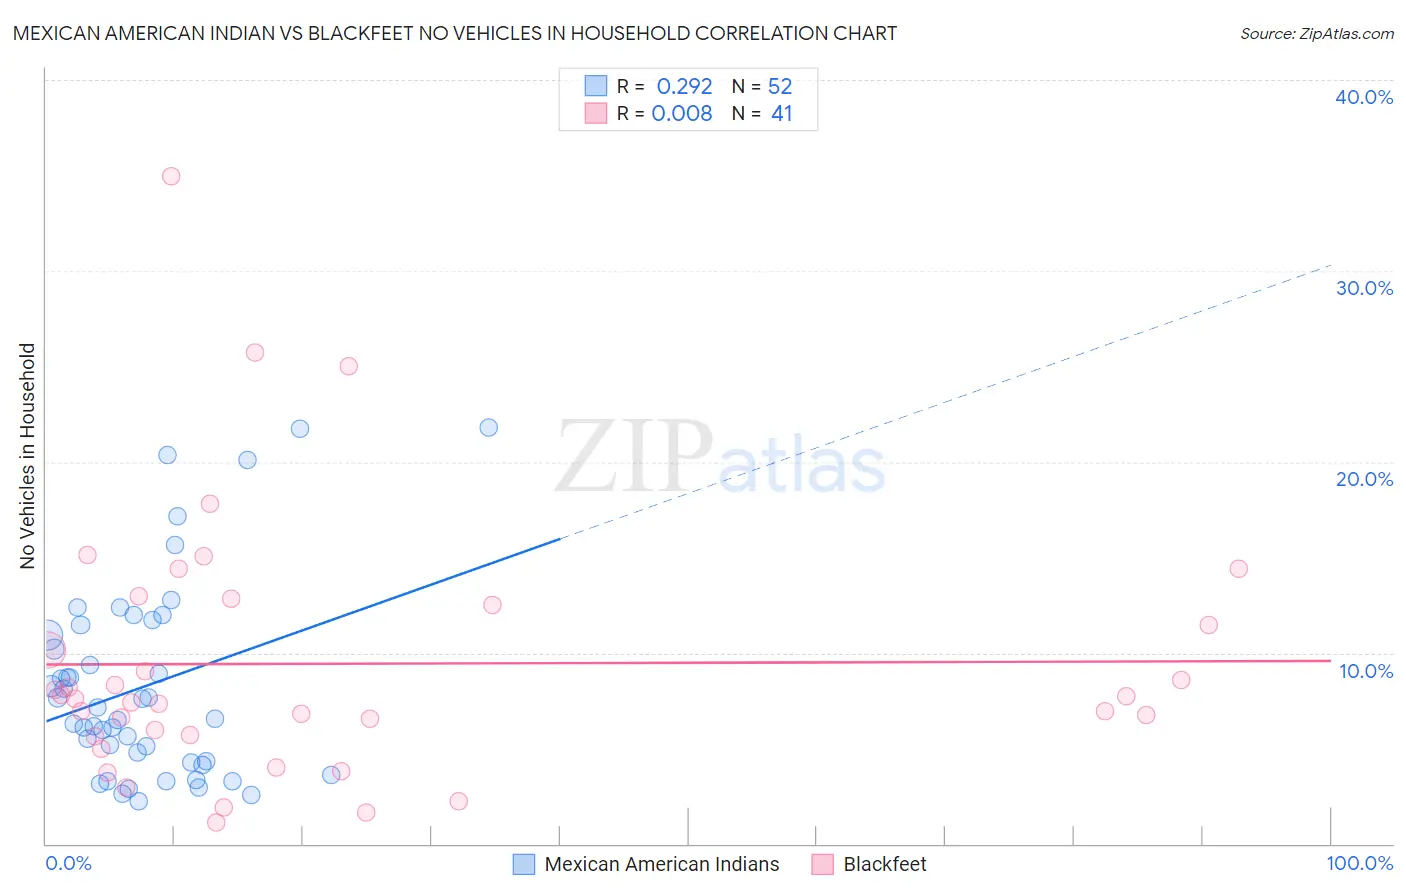
Mexican American Indian vs Blackfeet No Vehicles in Household Correlation Chart
The statistical analysis conducted on geographies consisting of 317,109,278 people shows a weak positive correlation between the proportion of Mexican American Indians and percentage of households with no vehicle available in the United States with a correlation coefficient (R) of 0.292 and weighted average of 9.1%. Similarly, the statistical analysis conducted on geographies consisting of 309,020,066 people shows no correlation between the proportion of Blackfeet and percentage of households with no vehicle available in the United States with a correlation coefficient (R) of 0.008 and weighted average of 9.6%, a difference of 5.3%.
No Vehicles in Household Correlation Summary
| Measurement | Mexican American Indian | Blackfeet |
| Minimum | 2.2% | 1.1% |
| Maximum | 21.8% | 34.9% |
| Range | 19.6% | 33.8% |
| Mean | 8.2% | 9.4% |
| Median | 6.8% | 7.6% |
| Interquartile 25% (IQ1) | 4.3% | 5.7% |
| Interquartile 75% (IQ3) | 11.2% | 12.7% |
| Interquartile Range (IQR) | 6.9% | 7.0% |
| Standard Deviation (Sample) | 5.1% | 6.9% |
| Standard Deviation (Population) | 5.1% | 6.8% |
Demographics Similar to Mexican American Indians and Blackfeet by No Vehicles in Household
In terms of no vehicles in household, the demographic groups most similar to Mexican American Indians are Hispanic or Latino (9.1%, a difference of 0.080%), Maltese (9.1%, a difference of 0.13%), Laotian (9.1%, a difference of 0.35%), Spanish American (9.1%, a difference of 0.44%), and Delaware (9.2%, a difference of 0.71%). Similarly, the demographic groups most similar to Blackfeet are Immigrants from Korea (9.6%, a difference of 0.23%), Immigrants from Cameroon (9.6%, a difference of 0.36%), Costa Rican (9.5%, a difference of 0.46%), Puget Sound Salish (9.5%, a difference of 0.51%), and Immigrants from Thailand (9.5%, a difference of 0.61%).
| Demographics | Rating | Rank | No Vehicles in Household |
| Spanish Americans | 97.9 /100 | #105 | Exceptional 9.1% |
| Laotians | 97.8 /100 | #106 | Exceptional 9.1% |
| Hispanics or Latinos | 97.7 /100 | #107 | Exceptional 9.1% |
| Mexican American Indians | 97.6 /100 | #108 | Exceptional 9.1% |
| Maltese | 97.6 /100 | #109 | Exceptional 9.1% |
| Delaware | 97.2 /100 | #110 | Exceptional 9.2% |
| Immigrants | Kuwait | 95.1 /100 | #111 | Exceptional 9.4% |
| Armenians | 95.0 /100 | #112 | Exceptional 9.4% |
| Immigrants | Netherlands | 94.8 /100 | #113 | Exceptional 9.4% |
| Serbians | 94.3 /100 | #114 | Exceptional 9.4% |
| Navajo | 94.2 /100 | #115 | Exceptional 9.4% |
| Japanese | 94.1 /100 | #116 | Exceptional 9.4% |
| Chippewa | 93.8 /100 | #117 | Exceptional 9.4% |
| Greeks | 92.9 /100 | #118 | Exceptional 9.5% |
| Fijians | 92.7 /100 | #119 | Exceptional 9.5% |
| Immigrants | Thailand | 92.6 /100 | #120 | Exceptional 9.5% |
| Puget Sound Salish | 92.4 /100 | #121 | Exceptional 9.5% |
| Costa Ricans | 92.3 /100 | #122 | Exceptional 9.5% |
| Blackfeet | 91.4 /100 | #123 | Exceptional 9.6% |
| Immigrants | Korea | 90.9 /100 | #124 | Exceptional 9.6% |
| Immigrants | Cameroon | 90.6 /100 | #125 | Exceptional 9.6% |