Korean vs Okinawan No Vehicles in Household
COMPARE
Korean
Okinawan
No Vehicles in Household
No Vehicles in Household Comparison
Koreans
Okinawans
8.0%
NO VEHICLES IN HOUSEHOLD
99.9/ 100
METRIC RATING
51st/ 347
METRIC RANK
14.1%
NO VEHICLES IN HOUSEHOLD
0.0/ 100
METRIC RATING
291st/ 347
METRIC RANK
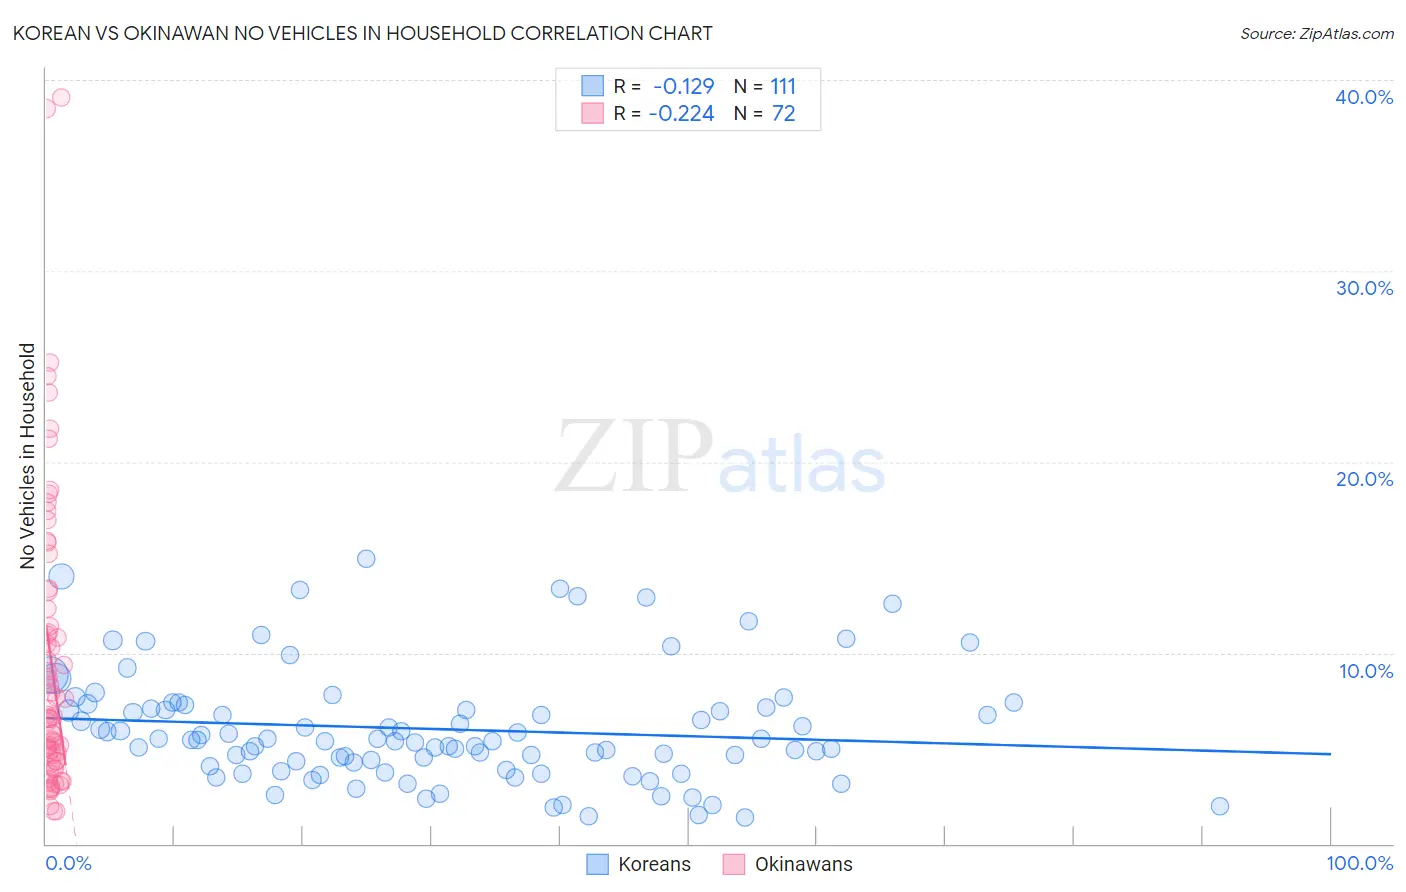
Korean vs Okinawan No Vehicles in Household Correlation Chart
The statistical analysis conducted on geographies consisting of 508,454,508 people shows a poor negative correlation between the proportion of Koreans and percentage of households with no vehicle available in the United States with a correlation coefficient (R) of -0.129 and weighted average of 8.0%. Similarly, the statistical analysis conducted on geographies consisting of 73,650,004 people shows a weak negative correlation between the proportion of Okinawans and percentage of households with no vehicle available in the United States with a correlation coefficient (R) of -0.224 and weighted average of 14.1%, a difference of 75.9%.
No Vehicles in Household Correlation Summary
| Measurement | Korean | Okinawan |
| Minimum | 1.4% | 1.7% |
| Maximum | 14.9% | 39.1% |
| Range | 13.6% | 37.3% |
| Mean | 6.0% | 9.5% |
| Median | 5.4% | 6.6% |
| Interquartile 25% (IQ1) | 4.1% | 4.3% |
| Interquartile 75% (IQ3) | 7.2% | 11.9% |
| Interquartile Range (IQR) | 3.1% | 7.5% |
| Standard Deviation (Sample) | 2.9% | 7.7% |
| Standard Deviation (Population) | 2.9% | 7.7% |
Similar Demographics by No Vehicles in Household
Demographics Similar to Koreans by No Vehicles in Household
In terms of no vehicles in household, the demographic groups most similar to Koreans are Belgian (8.0%, a difference of 0.10%), Guamanian/Chamorro (8.0%, a difference of 0.17%), Afghan (8.0%, a difference of 0.34%), Hawaiian (8.0%, a difference of 0.58%), and Slovene (8.0%, a difference of 0.58%).
| Demographics | Rating | Rank | No Vehicles in Household |
| Choctaw | 99.9 /100 | #44 | Exceptional 7.9% |
| Immigrants | Nonimmigrants | 99.9 /100 | #45 | Exceptional 7.9% |
| Spanish | 99.9 /100 | #46 | Exceptional 7.9% |
| Northern Europeans | 99.9 /100 | #47 | Exceptional 7.9% |
| Afghans | 99.9 /100 | #48 | Exceptional 8.0% |
| Guamanians/Chamorros | 99.9 /100 | #49 | Exceptional 8.0% |
| Belgians | 99.9 /100 | #50 | Exceptional 8.0% |
| Koreans | 99.9 /100 | #51 | Exceptional 8.0% |
| Hawaiians | 99.9 /100 | #52 | Exceptional 8.0% |
| Slovenes | 99.9 /100 | #53 | Exceptional 8.0% |
| Immigrants | Venezuela | 99.9 /100 | #54 | Exceptional 8.1% |
| Celtics | 99.9 /100 | #55 | Exceptional 8.1% |
| Immigrants | Afghanistan | 99.9 /100 | #56 | Exceptional 8.1% |
| Venezuelans | 99.8 /100 | #57 | Exceptional 8.1% |
| Immigrants | Mexico | 99.8 /100 | #58 | Exceptional 8.1% |
Demographics Similar to Okinawans by No Vehicles in Household
In terms of no vehicles in household, the demographic groups most similar to Okinawans are Indian (Asian) (14.1%, a difference of 0.0%), Pima (14.1%, a difference of 0.48%), Immigrants from Jamaica (14.2%, a difference of 1.1%), Immigrants from Australia (13.8%, a difference of 1.7%), and Belizean (14.3%, a difference of 1.9%).
| Demographics | Rating | Rank | No Vehicles in Household |
| Immigrants | Malaysia | 0.0 /100 | #284 | Tragic 13.6% |
| Immigrants | Eastern Europe | 0.0 /100 | #285 | Tragic 13.6% |
| Colville | 0.0 /100 | #286 | Tragic 13.7% |
| Immigrants | Ireland | 0.0 /100 | #287 | Tragic 13.7% |
| Hopi | 0.0 /100 | #288 | Tragic 13.7% |
| Immigrants | Australia | 0.0 /100 | #289 | Tragic 13.8% |
| Indians (Asian) | 0.0 /100 | #290 | Tragic 14.1% |
| Okinawans | 0.0 /100 | #291 | Tragic 14.1% |
| Pima | 0.0 /100 | #292 | Tragic 14.1% |
| Immigrants | Jamaica | 0.0 /100 | #293 | Tragic 14.2% |
| Belizeans | 0.0 /100 | #294 | Tragic 14.3% |
| Paraguayans | 0.0 /100 | #295 | Tragic 14.4% |
| Immigrants | Spain | 0.0 /100 | #296 | Tragic 14.5% |
| Immigrants | Panama | 0.0 /100 | #297 | Tragic 14.6% |
| Moroccans | 0.0 /100 | #298 | Tragic 14.7% |