Immigrants vs Chinese 1 or more Vehicles in Household
COMPARE
Immigrants
Chinese
1 or more Vehicles in Household
1 or more Vehicles in Household Comparison
Immigrants
Chinese
90.1%
1 OR MORE VEHICLES IN HOUSEHOLD
73.6/ 100
METRIC RATING
155th/ 347
METRIC RANK
91.9%
1 OR MORE VEHICLES IN HOUSEHOLD
99.8/ 100
METRIC RATING
63rd/ 347
METRIC RANK
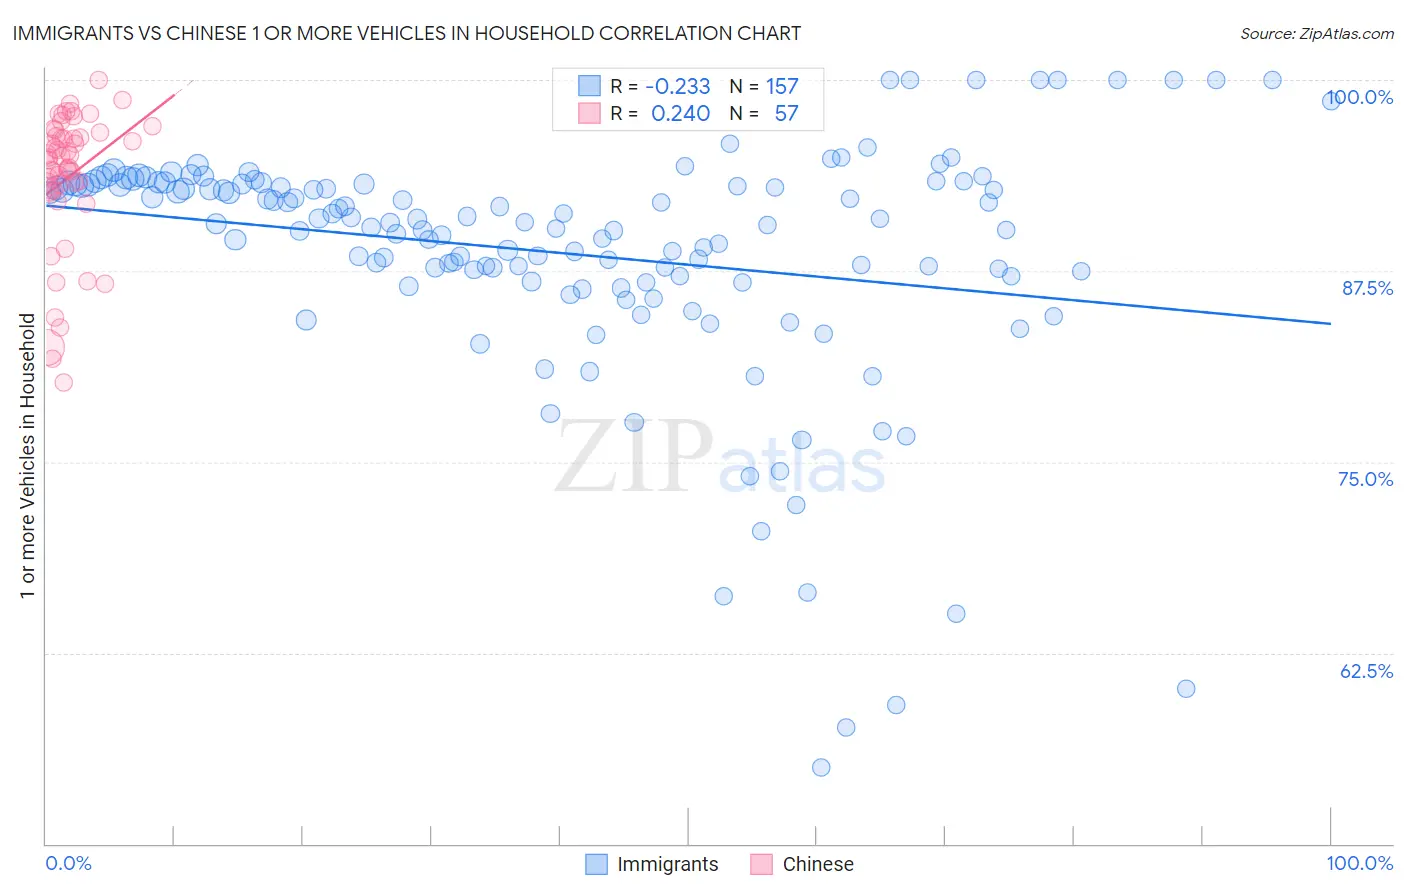
Immigrants vs Chinese 1 or more Vehicles in Household Correlation Chart
The statistical analysis conducted on geographies consisting of 566,737,688 people shows a weak negative correlation between the proportion of Immigrants and percentage of households with 1 or more vehicles available in the United States with a correlation coefficient (R) of -0.233 and weighted average of 90.1%. Similarly, the statistical analysis conducted on geographies consisting of 64,801,742 people shows a weak positive correlation between the proportion of Chinese and percentage of households with 1 or more vehicles available in the United States with a correlation coefficient (R) of 0.240 and weighted average of 91.9%, a difference of 2.0%.
1 or more Vehicles in Household Correlation Summary
| Measurement | Immigrants | Chinese |
| Minimum | 55.0% | 80.2% |
| Maximum | 100.0% | 100.0% |
| Range | 45.0% | 19.8% |
| Mean | 88.7% | 93.6% |
| Median | 90.6% | 94.9% |
| Interquartile 25% (IQ1) | 87.0% | 92.8% |
| Interquartile 75% (IQ3) | 93.2% | 96.4% |
| Interquartile Range (IQR) | 6.2% | 3.6% |
| Standard Deviation (Sample) | 8.1% | 4.5% |
| Standard Deviation (Population) | 8.1% | 4.5% |
Similar Demographics by 1 or more Vehicles in Household
Demographics Similar to Immigrants by 1 or more Vehicles in Household
In terms of 1 or more vehicles in household, the demographic groups most similar to Immigrants are New Zealander (90.1%, a difference of 0.0%), Immigrants from Uganda (90.1%, a difference of 0.0%), Tlingit-Haida (90.1%, a difference of 0.010%), Australian (90.0%, a difference of 0.020%), and Immigrants from Bosnia and Herzegovina (90.1%, a difference of 0.040%).
| Demographics | Rating | Rank | 1 or more Vehicles in Household |
| Immigrants | Eastern Africa | 78.2 /100 | #148 | Good 90.1% |
| Immigrants | Nicaragua | 76.7 /100 | #149 | Good 90.1% |
| Immigrants | Micronesia | 75.9 /100 | #150 | Good 90.1% |
| Immigrants | Bosnia and Herzegovina | 75.4 /100 | #151 | Good 90.1% |
| Tlingit-Haida | 74.3 /100 | #152 | Good 90.1% |
| New Zealanders | 73.8 /100 | #153 | Good 90.1% |
| Immigrants | Uganda | 73.8 /100 | #154 | Good 90.1% |
| Immigrants | Immigrants | 73.6 /100 | #155 | Good 90.1% |
| Australians | 72.4 /100 | #156 | Good 90.0% |
| Immigrants | Congo | 71.2 /100 | #157 | Good 90.0% |
| Brazilians | 71.0 /100 | #158 | Good 90.0% |
| South Africans | 69.7 /100 | #159 | Good 90.0% |
| Immigrants | Indonesia | 68.8 /100 | #160 | Good 90.0% |
| Salvadorans | 68.7 /100 | #161 | Good 90.0% |
| Spanish American Indians | 67.0 /100 | #162 | Good 89.9% |
Demographics Similar to Chinese by 1 or more Vehicles in Household
In terms of 1 or more vehicles in household, the demographic groups most similar to Chinese are Croatian (91.9%, a difference of 0.010%), Thai (91.9%, a difference of 0.020%), Immigrants from India (91.9%, a difference of 0.030%), Immigrants from Laos (91.8%, a difference of 0.030%), and Slovak (91.9%, a difference of 0.040%).
| Demographics | Rating | Rank | 1 or more Vehicles in Household |
| Immigrants | Venezuela | 99.9 /100 | #56 | Exceptional 92.0% |
| Iraqis | 99.8 /100 | #57 | Exceptional 91.9% |
| Immigrants | Mexico | 99.8 /100 | #58 | Exceptional 91.9% |
| Venezuelans | 99.8 /100 | #59 | Exceptional 91.9% |
| Slovaks | 99.8 /100 | #60 | Exceptional 91.9% |
| Immigrants | India | 99.8 /100 | #61 | Exceptional 91.9% |
| Thais | 99.8 /100 | #62 | Exceptional 91.9% |
| Chinese | 99.8 /100 | #63 | Exceptional 91.9% |
| Croatians | 99.8 /100 | #64 | Exceptional 91.9% |
| Immigrants | Laos | 99.8 /100 | #65 | Exceptional 91.8% |
| Canadians | 99.8 /100 | #66 | Exceptional 91.8% |
| Spaniards | 99.8 /100 | #67 | Exceptional 91.8% |
| Immigrants | Scotland | 99.7 /100 | #68 | Exceptional 91.8% |
| Palestinians | 99.7 /100 | #69 | Exceptional 91.7% |
| Lithuanians | 99.7 /100 | #70 | Exceptional 91.7% |