Immigrants from Spain vs Cuban No Vehicles in Household
COMPARE
Immigrants from Spain
Cuban
No Vehicles in Household
No Vehicles in Household Comparison
Immigrants from Spain
Cubans
14.5%
NO VEHICLES IN HOUSEHOLD
0.0/ 100
METRIC RATING
296th/ 347
METRIC RANK
8.5%
NO VEHICLES IN HOUSEHOLD
99.5/ 100
METRIC RATING
74th/ 347
METRIC RANK
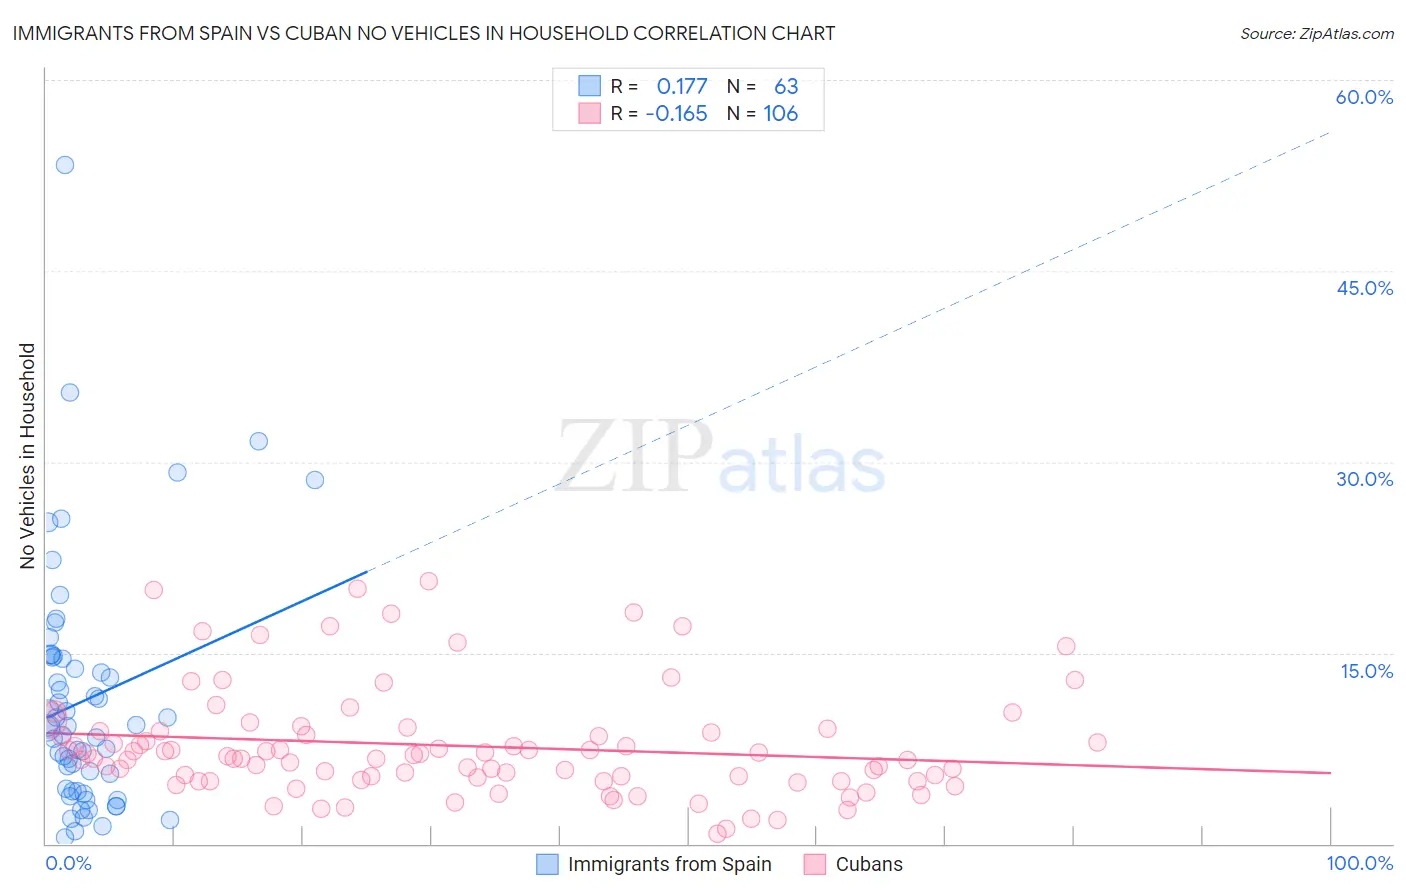
Immigrants from Spain vs Cuban No Vehicles in Household Correlation Chart
The statistical analysis conducted on geographies consisting of 239,372,096 people shows a poor positive correlation between the proportion of Immigrants from Spain and percentage of households with no vehicle available in the United States with a correlation coefficient (R) of 0.177 and weighted average of 14.5%. Similarly, the statistical analysis conducted on geographies consisting of 447,809,570 people shows a poor negative correlation between the proportion of Cubans and percentage of households with no vehicle available in the United States with a correlation coefficient (R) of -0.165 and weighted average of 8.5%, a difference of 71.0%.
No Vehicles in Household Correlation Summary
| Measurement | Immigrants from Spain | Cuban |
| Minimum | 0.51% | 0.80% |
| Maximum | 53.3% | 20.7% |
| Range | 52.8% | 19.9% |
| Mean | 11.3% | 7.7% |
| Median | 9.2% | 6.8% |
| Interquartile 25% (IQ1) | 4.1% | 5.0% |
| Interquartile 75% (IQ3) | 14.6% | 8.8% |
| Interquartile Range (IQR) | 10.5% | 3.8% |
| Standard Deviation (Sample) | 9.6% | 4.3% |
| Standard Deviation (Population) | 9.5% | 4.2% |
Similar Demographics by No Vehicles in Household
Demographics Similar to Immigrants from Spain by No Vehicles in Household
In terms of no vehicles in household, the demographic groups most similar to Immigrants from Spain are Immigrants from Panama (14.6%, a difference of 0.67%), Moroccan (14.7%, a difference of 0.82%), Immigrants from Greece (14.7%, a difference of 1.0%), Paraguayan (14.4%, a difference of 1.3%), and Belizean (14.3%, a difference of 1.5%).
| Demographics | Rating | Rank | No Vehicles in Household |
| Immigrants | Australia | 0.0 /100 | #289 | Tragic 13.8% |
| Indians (Asian) | 0.0 /100 | #290 | Tragic 14.1% |
| Okinawans | 0.0 /100 | #291 | Tragic 14.1% |
| Pima | 0.0 /100 | #292 | Tragic 14.1% |
| Immigrants | Jamaica | 0.0 /100 | #293 | Tragic 14.2% |
| Belizeans | 0.0 /100 | #294 | Tragic 14.3% |
| Paraguayans | 0.0 /100 | #295 | Tragic 14.4% |
| Immigrants | Spain | 0.0 /100 | #296 | Tragic 14.5% |
| Immigrants | Panama | 0.0 /100 | #297 | Tragic 14.6% |
| Moroccans | 0.0 /100 | #298 | Tragic 14.7% |
| Immigrants | Greece | 0.0 /100 | #299 | Tragic 14.7% |
| Yuman | 0.0 /100 | #300 | Tragic 14.9% |
| Immigrants | Ukraine | 0.0 /100 | #301 | Tragic 14.9% |
| Haitians | 0.0 /100 | #302 | Tragic 14.9% |
| Immigrants | Western Africa | 0.0 /100 | #303 | Tragic 15.0% |
Demographics Similar to Cubans by No Vehicles in Household
In terms of no vehicles in household, the demographic groups most similar to Cubans are Jordanian (8.5%, a difference of 0.22%), Immigrants from Philippines (8.5%, a difference of 0.46%), Iranian (8.6%, a difference of 0.55%), Immigrants from South Central Asia (8.6%, a difference of 0.67%), and Portuguese (8.6%, a difference of 0.73%).
| Demographics | Rating | Rank | No Vehicles in Household |
| Immigrants | Scotland | 99.7 /100 | #67 | Exceptional 8.3% |
| Immigrants | Iran | 99.7 /100 | #68 | Exceptional 8.4% |
| Spaniards | 99.7 /100 | #69 | Exceptional 8.4% |
| Cajuns | 99.6 /100 | #70 | Exceptional 8.4% |
| Immigrants | Lebanon | 99.6 /100 | #71 | Exceptional 8.4% |
| Lithuanians | 99.6 /100 | #72 | Exceptional 8.4% |
| Poles | 99.6 /100 | #73 | Exceptional 8.4% |
| Cubans | 99.5 /100 | #74 | Exceptional 8.5% |
| Jordanians | 99.5 /100 | #75 | Exceptional 8.5% |
| Immigrants | Philippines | 99.5 /100 | #76 | Exceptional 8.5% |
| Iranians | 99.5 /100 | #77 | Exceptional 8.6% |
| Immigrants | South Central Asia | 99.5 /100 | #78 | Exceptional 8.6% |
| Portuguese | 99.5 /100 | #79 | Exceptional 8.6% |
| Bolivians | 99.4 /100 | #80 | Exceptional 8.6% |
| Tsimshian | 99.4 /100 | #81 | Exceptional 8.6% |