Immigrants from Israel vs Cuban No Vehicles in Household
COMPARE
Immigrants from Israel
Cuban
No Vehicles in Household
No Vehicles in Household Comparison
Immigrants from Israel
Cubans
15.6%
NO VEHICLES IN HOUSEHOLD
0.0/ 100
METRIC RATING
311th/ 347
METRIC RANK
8.5%
NO VEHICLES IN HOUSEHOLD
99.5/ 100
METRIC RATING
74th/ 347
METRIC RANK
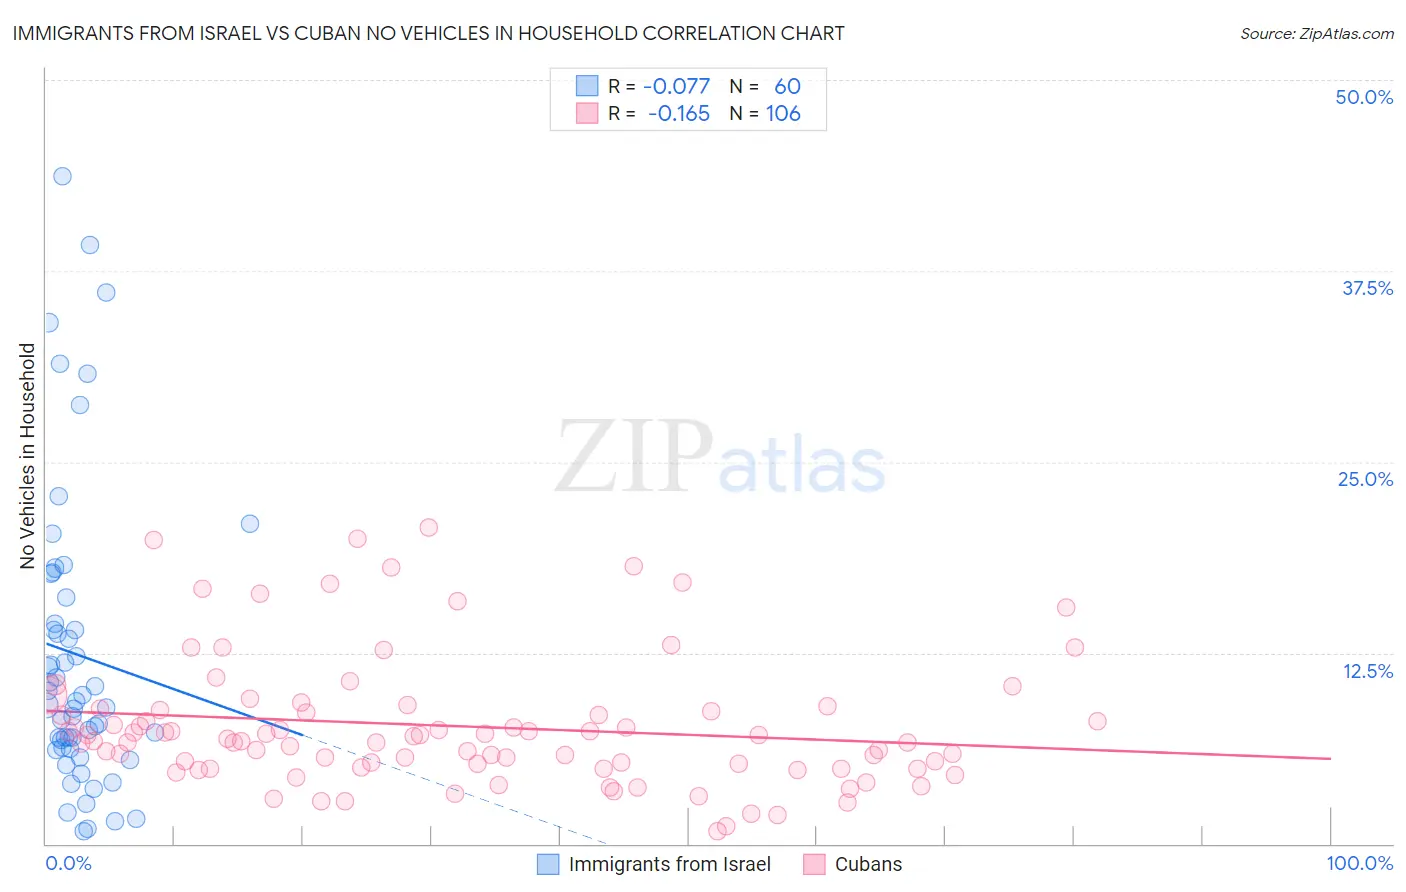
Immigrants from Israel vs Cuban No Vehicles in Household Correlation Chart
The statistical analysis conducted on geographies consisting of 209,834,938 people shows a slight negative correlation between the proportion of Immigrants from Israel and percentage of households with no vehicle available in the United States with a correlation coefficient (R) of -0.077 and weighted average of 15.6%. Similarly, the statistical analysis conducted on geographies consisting of 447,809,570 people shows a poor negative correlation between the proportion of Cubans and percentage of households with no vehicle available in the United States with a correlation coefficient (R) of -0.165 and weighted average of 8.5%, a difference of 83.0%.
No Vehicles in Household Correlation Summary
| Measurement | Immigrants from Israel | Cuban |
| Minimum | 0.81% | 0.80% |
| Maximum | 43.7% | 20.7% |
| Range | 42.9% | 19.9% |
| Mean | 12.4% | 7.7% |
| Median | 9.2% | 6.8% |
| Interquartile 25% (IQ1) | 6.3% | 5.0% |
| Interquartile 75% (IQ3) | 15.3% | 8.8% |
| Interquartile Range (IQR) | 9.0% | 3.8% |
| Standard Deviation (Sample) | 9.8% | 4.3% |
| Standard Deviation (Population) | 9.7% | 4.2% |
Similar Demographics by No Vehicles in Household
Demographics Similar to Immigrants from Israel by No Vehicles in Household
In terms of no vehicles in household, the demographic groups most similar to Immigrants from Israel are Cape Verdean (15.6%, a difference of 0.010%), Alaskan Athabascan (15.6%, a difference of 0.15%), Tohono O'odham (15.6%, a difference of 0.30%), Albanian (15.6%, a difference of 0.46%), and Puerto Rican (15.5%, a difference of 0.57%).
| Demographics | Rating | Rank | No Vehicles in Household |
| Immigrants | Russia | 0.0 /100 | #304 | Tragic 15.1% |
| Immigrants | China | 0.0 /100 | #305 | Tragic 15.2% |
| Immigrants | Belize | 0.0 /100 | #306 | Tragic 15.4% |
| Immigrants | Haiti | 0.0 /100 | #307 | Tragic 15.4% |
| U.S. Virgin Islanders | 0.0 /100 | #308 | Tragic 15.4% |
| Puerto Ricans | 0.0 /100 | #309 | Tragic 15.5% |
| Cape Verdeans | 0.0 /100 | #310 | Tragic 15.6% |
| Immigrants | Israel | 0.0 /100 | #311 | Tragic 15.6% |
| Alaskan Athabascans | 0.0 /100 | #312 | Tragic 15.6% |
| Tohono O'odham | 0.0 /100 | #313 | Tragic 15.6% |
| Albanians | 0.0 /100 | #314 | Tragic 15.6% |
| Cypriots | 0.0 /100 | #315 | Tragic 15.7% |
| Ghanaians | 0.0 /100 | #316 | Tragic 16.4% |
| Immigrants | Ghana | 0.0 /100 | #317 | Tragic 16.6% |
| Immigrants | Belarus | 0.0 /100 | #318 | Tragic 16.7% |
Demographics Similar to Cubans by No Vehicles in Household
In terms of no vehicles in household, the demographic groups most similar to Cubans are Jordanian (8.5%, a difference of 0.22%), Immigrants from Philippines (8.5%, a difference of 0.46%), Iranian (8.6%, a difference of 0.55%), Immigrants from South Central Asia (8.6%, a difference of 0.67%), and Portuguese (8.6%, a difference of 0.73%).
| Demographics | Rating | Rank | No Vehicles in Household |
| Immigrants | Scotland | 99.7 /100 | #67 | Exceptional 8.3% |
| Immigrants | Iran | 99.7 /100 | #68 | Exceptional 8.4% |
| Spaniards | 99.7 /100 | #69 | Exceptional 8.4% |
| Cajuns | 99.6 /100 | #70 | Exceptional 8.4% |
| Immigrants | Lebanon | 99.6 /100 | #71 | Exceptional 8.4% |
| Lithuanians | 99.6 /100 | #72 | Exceptional 8.4% |
| Poles | 99.6 /100 | #73 | Exceptional 8.4% |
| Cubans | 99.5 /100 | #74 | Exceptional 8.5% |
| Jordanians | 99.5 /100 | #75 | Exceptional 8.5% |
| Immigrants | Philippines | 99.5 /100 | #76 | Exceptional 8.5% |
| Iranians | 99.5 /100 | #77 | Exceptional 8.6% |
| Immigrants | South Central Asia | 99.5 /100 | #78 | Exceptional 8.6% |
| Portuguese | 99.5 /100 | #79 | Exceptional 8.6% |
| Bolivians | 99.4 /100 | #80 | Exceptional 8.6% |
| Tsimshian | 99.4 /100 | #81 | Exceptional 8.6% |