Immigrants from Philippines vs Somali 4 or more Vehicles in Household
COMPARE
Immigrants from Philippines
Somali
4 or more Vehicles in Household
4 or more Vehicles in Household Comparison
Immigrants from Philippines
Somalis
8.5%
4 OR MORE VEHICLES IN HOUSEHOLD
100.0/ 100
METRIC RATING
23rd/ 347
METRIC RANK
5.0%
4 OR MORE VEHICLES IN HOUSEHOLD
0.0/ 100
METRIC RATING
305th/ 347
METRIC RANK
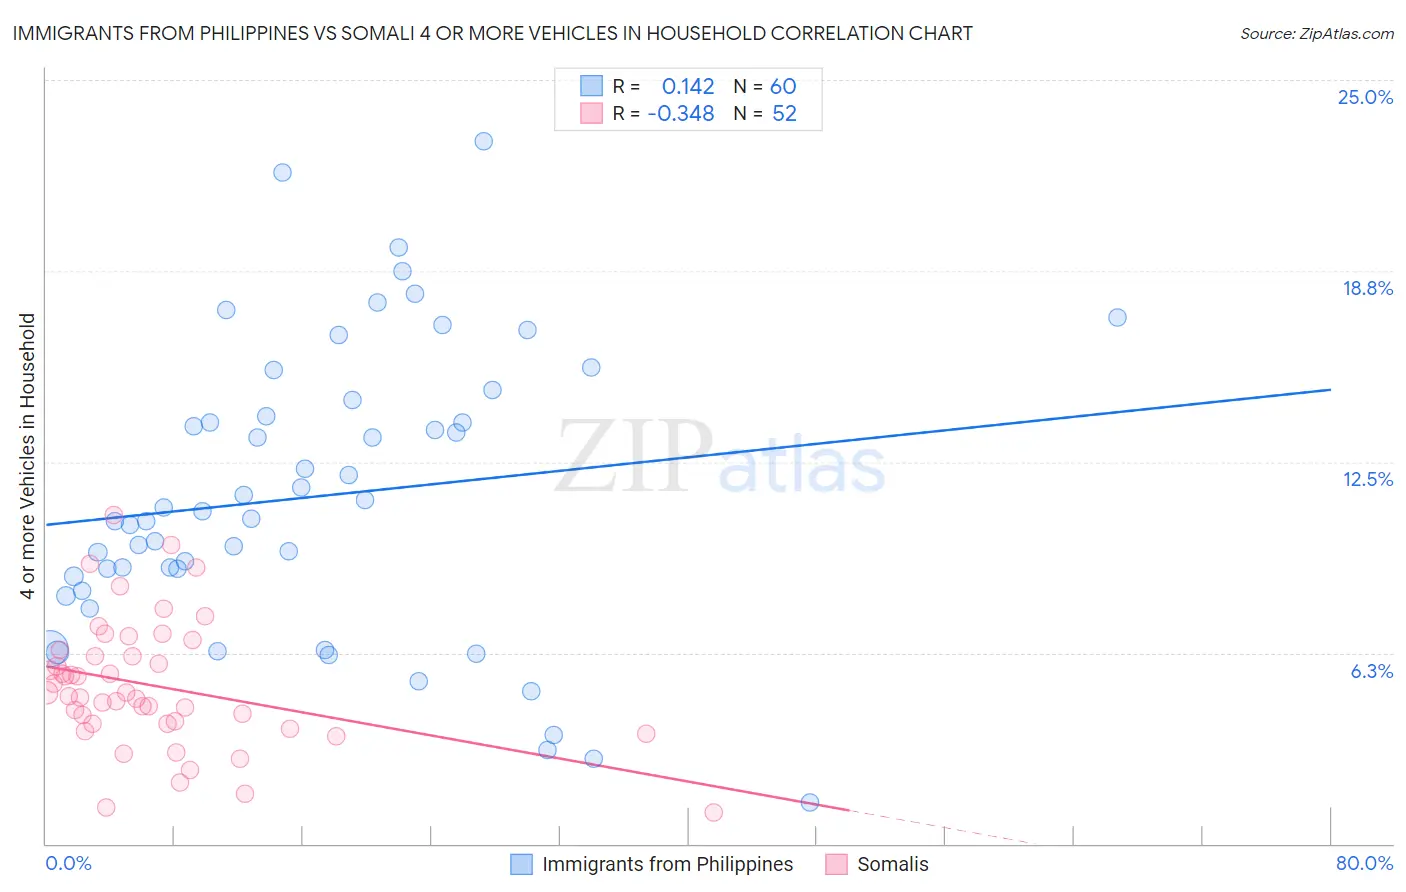
Immigrants from Philippines vs Somali 4 or more Vehicles in Household Correlation Chart
The statistical analysis conducted on geographies consisting of 469,114,664 people shows a poor positive correlation between the proportion of Immigrants from Philippines and percentage of households with 4 or more vehicles available in the United States with a correlation coefficient (R) of 0.142 and weighted average of 8.5%. Similarly, the statistical analysis conducted on geographies consisting of 99,181,169 people shows a mild negative correlation between the proportion of Somalis and percentage of households with 4 or more vehicles available in the United States with a correlation coefficient (R) of -0.348 and weighted average of 5.0%, a difference of 70.1%.
4 or more Vehicles in Household Correlation Summary
| Measurement | Immigrants from Philippines | Somali |
| Minimum | 1.4% | 1.0% |
| Maximum | 23.0% | 10.8% |
| Range | 21.6% | 9.7% |
| Mean | 11.4% | 5.2% |
| Median | 10.8% | 4.9% |
| Interquartile 25% (IQ1) | 8.5% | 3.9% |
| Interquartile 75% (IQ3) | 14.3% | 6.2% |
| Interquartile Range (IQR) | 5.7% | 2.3% |
| Standard Deviation (Sample) | 4.7% | 2.1% |
| Standard Deviation (Population) | 4.7% | 2.1% |
Similar Demographics by 4 or more Vehicles in Household
Demographics Similar to Immigrants from Philippines by 4 or more Vehicles in Household
In terms of 4 or more vehicles in household, the demographic groups most similar to Immigrants from Philippines are Immigrants from Vietnam (8.6%, a difference of 0.21%), Danish (8.6%, a difference of 0.26%), Pueblo (8.6%, a difference of 0.31%), Immigrants from Central America (8.5%, a difference of 0.82%), and Korean (8.6%, a difference of 1.1%).
| Demographics | Rating | Rank | 4 or more Vehicles in Household |
| Lumbee | 100.0 /100 | #16 | Exceptional 8.8% |
| Ute | 100.0 /100 | #17 | Exceptional 8.8% |
| Nepalese | 100.0 /100 | #18 | Exceptional 8.7% |
| Koreans | 100.0 /100 | #19 | Exceptional 8.6% |
| Pueblo | 100.0 /100 | #20 | Exceptional 8.6% |
| Danes | 100.0 /100 | #21 | Exceptional 8.6% |
| Immigrants | Vietnam | 100.0 /100 | #22 | Exceptional 8.6% |
| Immigrants | Philippines | 100.0 /100 | #23 | Exceptional 8.5% |
| Immigrants | Central America | 100.0 /100 | #24 | Exceptional 8.5% |
| Basques | 100.0 /100 | #25 | Exceptional 8.4% |
| Mexican American Indians | 100.0 /100 | #26 | Exceptional 8.4% |
| Sri Lankans | 100.0 /100 | #27 | Exceptional 8.4% |
| Cheyenne | 100.0 /100 | #28 | Exceptional 8.3% |
| Immigrants | South Eastern Asia | 100.0 /100 | #29 | Exceptional 8.2% |
| Navajo | 100.0 /100 | #30 | Exceptional 8.2% |
Demographics Similar to Somalis by 4 or more Vehicles in Household
In terms of 4 or more vehicles in household, the demographic groups most similar to Somalis are Cypriot (5.0%, a difference of 0.0%), Immigrants from Serbia (5.0%, a difference of 0.090%), Immigrants from Greece (5.1%, a difference of 0.56%), Bahamian (5.1%, a difference of 1.0%), and Menominee (5.0%, a difference of 1.0%).
| Demographics | Rating | Rank | 4 or more Vehicles in Household |
| Immigrants | South America | 0.1 /100 | #298 | Tragic 5.2% |
| Immigrants | Ghana | 0.1 /100 | #299 | Tragic 5.2% |
| Immigrants | Morocco | 0.0 /100 | #300 | Tragic 5.1% |
| Immigrants | Zaire | 0.0 /100 | #301 | Tragic 5.1% |
| Bahamians | 0.0 /100 | #302 | Tragic 5.1% |
| Immigrants | Greece | 0.0 /100 | #303 | Tragic 5.1% |
| Cypriots | 0.0 /100 | #304 | Tragic 5.0% |
| Somalis | 0.0 /100 | #305 | Tragic 5.0% |
| Immigrants | Serbia | 0.0 /100 | #306 | Tragic 5.0% |
| Menominee | 0.0 /100 | #307 | Tragic 5.0% |
| Paraguayans | 0.0 /100 | #308 | Tragic 4.9% |
| Immigrants | Somalia | 0.0 /100 | #309 | Tragic 4.9% |
| Moroccans | 0.0 /100 | #310 | Tragic 4.9% |
| Houma | 0.0 /100 | #311 | Tragic 4.9% |
| Albanians | 0.0 /100 | #312 | Tragic 4.8% |