Immigrants from Oceania vs Sri Lankan 1 or more Vehicles in Household
COMPARE
Immigrants from Oceania
Sri Lankan
1 or more Vehicles in Household
1 or more Vehicles in Household Comparison
Immigrants from Oceania
Sri Lankans
90.4%
1 OR MORE VEHICLES IN HOUSEHOLD
86.9/ 100
METRIC RATING
135th/ 347
METRIC RANK
92.5%
1 OR MORE VEHICLES IN HOUSEHOLD
100.0/ 100
METRIC RATING
28th/ 347
METRIC RANK
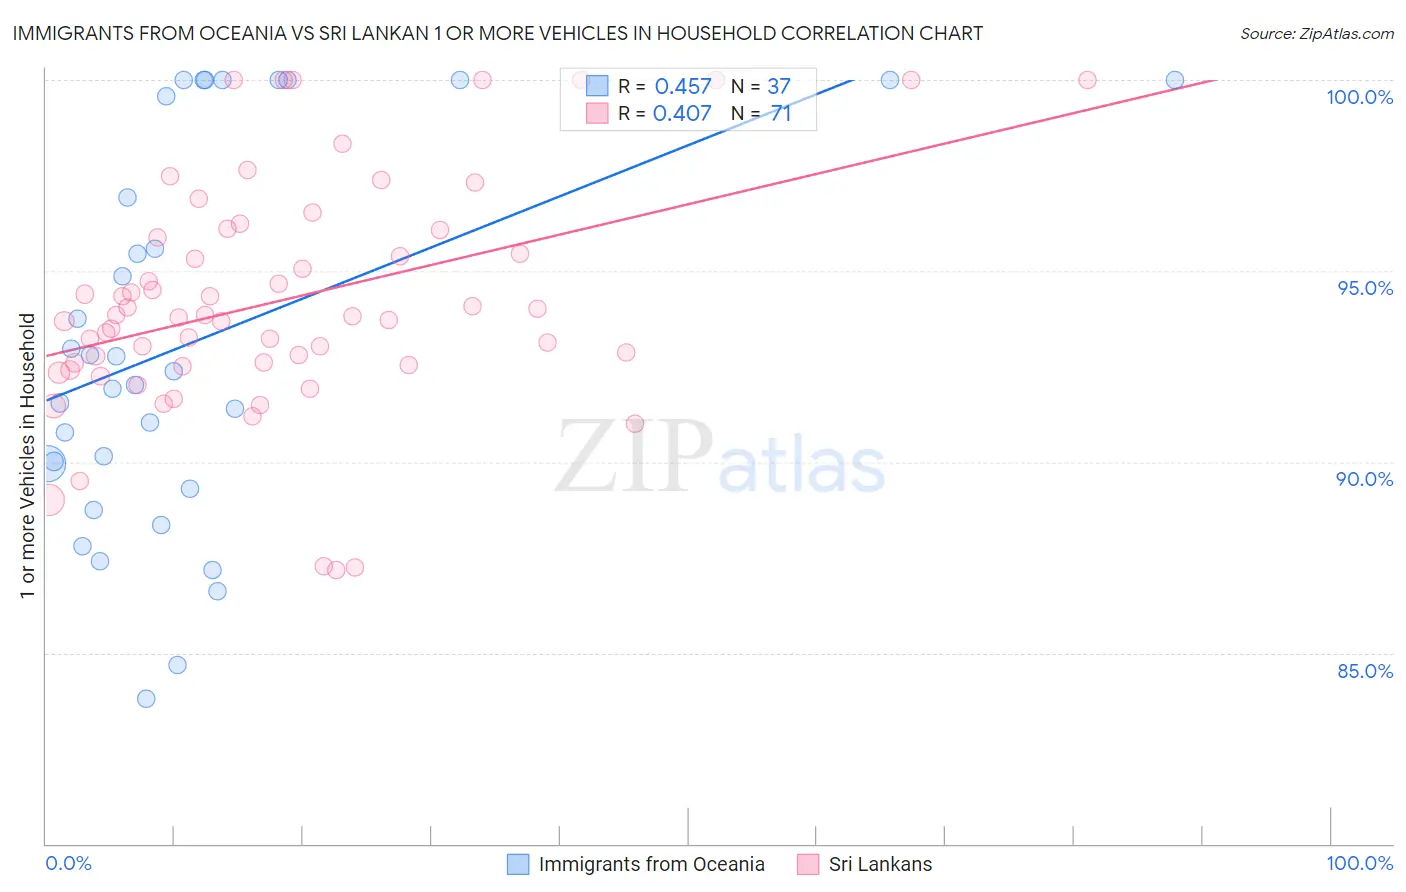
Immigrants from Oceania vs Sri Lankan 1 or more Vehicles in Household Correlation Chart
The statistical analysis conducted on geographies consisting of 305,395,029 people shows a moderate positive correlation between the proportion of Immigrants from Oceania and percentage of households with 1 or more vehicles available in the United States with a correlation coefficient (R) of 0.457 and weighted average of 90.4%. Similarly, the statistical analysis conducted on geographies consisting of 440,171,076 people shows a moderate positive correlation between the proportion of Sri Lankans and percentage of households with 1 or more vehicles available in the United States with a correlation coefficient (R) of 0.407 and weighted average of 92.5%, a difference of 2.3%.
1 or more Vehicles in Household Correlation Summary
| Measurement | Immigrants from Oceania | Sri Lankan |
| Minimum | 83.8% | 87.2% |
| Maximum | 100.0% | 100.0% |
| Range | 16.2% | 12.8% |
| Mean | 93.2% | 94.2% |
| Median | 92.4% | 93.8% |
| Interquartile 25% (IQ1) | 89.6% | 92.6% |
| Interquartile 75% (IQ3) | 99.8% | 96.1% |
| Interquartile Range (IQR) | 10.2% | 3.5% |
| Standard Deviation (Sample) | 5.0% | 3.0% |
| Standard Deviation (Population) | 4.9% | 3.0% |
Similar Demographics by 1 or more Vehicles in Household
Demographics Similar to Immigrants from Oceania by 1 or more Vehicles in Household
In terms of 1 or more vehicles in household, the demographic groups most similar to Immigrants from Oceania are Kenyan (90.4%, a difference of 0.0%), Immigrants from Syria (90.4%, a difference of 0.020%), Hungarian (90.3%, a difference of 0.020%), Latvian (90.3%, a difference of 0.020%), and Syrian (90.3%, a difference of 0.020%).
| Demographics | Rating | Rank | 1 or more Vehicles in Household |
| Burmese | 89.0 /100 | #128 | Excellent 90.4% |
| Marshallese | 88.9 /100 | #129 | Excellent 90.4% |
| Nicaraguans | 88.8 /100 | #130 | Excellent 90.4% |
| Immigrants | Kenya | 88.5 /100 | #131 | Excellent 90.4% |
| Immigrants | South Africa | 88.1 /100 | #132 | Excellent 90.4% |
| Immigrants | Syria | 87.5 /100 | #133 | Excellent 90.4% |
| Kenyans | 87.0 /100 | #134 | Excellent 90.4% |
| Immigrants | Oceania | 86.9 /100 | #135 | Excellent 90.4% |
| Hungarians | 86.5 /100 | #136 | Excellent 90.3% |
| Latvians | 86.3 /100 | #137 | Excellent 90.3% |
| Syrians | 86.3 /100 | #138 | Excellent 90.3% |
| Estonians | 85.6 /100 | #139 | Excellent 90.3% |
| Sudanese | 85.2 /100 | #140 | Excellent 90.3% |
| Immigrants | Moldova | 83.1 /100 | #141 | Excellent 90.2% |
| Immigrants | Lithuania | 83.0 /100 | #142 | Excellent 90.2% |
Demographics Similar to Sri Lankans by 1 or more Vehicles in Household
In terms of 1 or more vehicles in household, the demographic groups most similar to Sri Lankans are Native Hawaiian (92.4%, a difference of 0.010%), Finnish (92.4%, a difference of 0.020%), American (92.5%, a difference of 0.030%), Samoan (92.4%, a difference of 0.030%), and Basque (92.4%, a difference of 0.070%).
| Demographics | Rating | Rank | 1 or more Vehicles in Household |
| Ottawa | 100.0 /100 | #21 | Exceptional 92.7% |
| French | 100.0 /100 | #22 | Exceptional 92.7% |
| Nepalese | 100.0 /100 | #23 | Exceptional 92.6% |
| Yaqui | 100.0 /100 | #24 | Exceptional 92.6% |
| Immigrants | Iraq | 100.0 /100 | #25 | Exceptional 92.5% |
| British | 100.0 /100 | #26 | Exceptional 92.5% |
| Americans | 100.0 /100 | #27 | Exceptional 92.5% |
| Sri Lankans | 100.0 /100 | #28 | Exceptional 92.5% |
| Native Hawaiians | 100.0 /100 | #29 | Exceptional 92.4% |
| Finns | 100.0 /100 | #30 | Exceptional 92.4% |
| Samoans | 100.0 /100 | #31 | Exceptional 92.4% |
| Basques | 100.0 /100 | #32 | Exceptional 92.4% |
| Cherokee | 100.0 /100 | #33 | Exceptional 92.4% |
| Italians | 99.9 /100 | #34 | Exceptional 92.3% |
| Czechoslovakians | 99.9 /100 | #35 | Exceptional 92.3% |