Immigrants from Northern Europe vs Immigrants from Western Asia Male Disability
COMPARE
Immigrants from Northern Europe
Immigrants from Western Asia
Male Disability
Male Disability Comparison
Immigrants from Northern Europe
Immigrants from Western Asia
11.1%
MALE DISABILITY
73.2/ 100
METRIC RATING
153rd/ 347
METRIC RANK
10.6%
MALE DISABILITY
97.8/ 100
METRIC RATING
88th/ 347
METRIC RANK
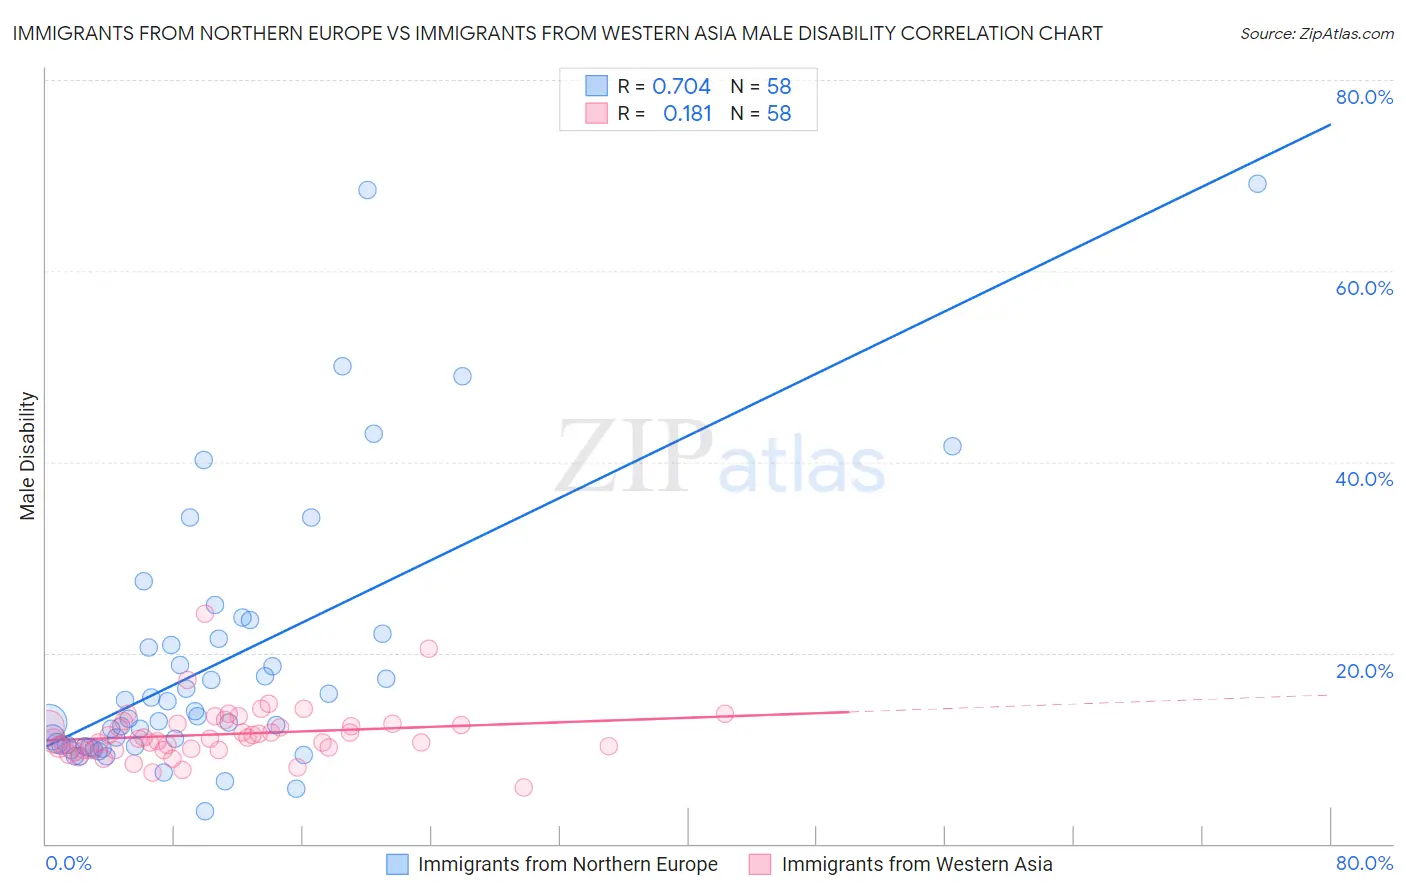
Immigrants from Northern Europe vs Immigrants from Western Asia Male Disability Correlation Chart
The statistical analysis conducted on geographies consisting of 477,177,667 people shows a strong positive correlation between the proportion of Immigrants from Northern Europe and percentage of males with a disability in the United States with a correlation coefficient (R) of 0.704 and weighted average of 11.1%. Similarly, the statistical analysis conducted on geographies consisting of 404,415,030 people shows a poor positive correlation between the proportion of Immigrants from Western Asia and percentage of males with a disability in the United States with a correlation coefficient (R) of 0.181 and weighted average of 10.6%, a difference of 4.0%.
Male Disability Correlation Summary
| Measurement | Immigrants from Northern Europe | Immigrants from Western Asia |
| Minimum | 3.4% | 5.9% |
| Maximum | 69.2% | 24.0% |
| Range | 65.8% | 18.1% |
| Mean | 19.0% | 11.5% |
| Median | 13.3% | 11.0% |
| Interquartile 25% (IQ1) | 10.2% | 9.9% |
| Interquartile 75% (IQ3) | 21.4% | 12.6% |
| Interquartile Range (IQR) | 11.2% | 2.7% |
| Standard Deviation (Sample) | 14.2% | 2.9% |
| Standard Deviation (Population) | 14.1% | 2.8% |
Similar Demographics by Male Disability
Demographics Similar to Immigrants from Northern Europe by Male Disability
In terms of male disability, the demographic groups most similar to Immigrants from Northern Europe are Immigrants from Moldova (11.1%, a difference of 0.020%), Immigrants from Albania (11.0%, a difference of 0.090%), Cuban (11.0%, a difference of 0.12%), Immigrants from Guatemala (11.0%, a difference of 0.14%), and Immigrants from Middle Africa (11.1%, a difference of 0.16%).
| Demographics | Rating | Rank | Male Disability |
| Koreans | 77.5 /100 | #146 | Good 11.0% |
| Immigrants | Croatia | 77.3 /100 | #147 | Good 11.0% |
| Sudanese | 77.1 /100 | #148 | Good 11.0% |
| Immigrants | Denmark | 76.4 /100 | #149 | Good 11.0% |
| Immigrants | Guatemala | 75.1 /100 | #150 | Good 11.0% |
| Cubans | 74.9 /100 | #151 | Good 11.0% |
| Immigrants | Albania | 74.4 /100 | #152 | Good 11.0% |
| Immigrants | Northern Europe | 73.2 /100 | #153 | Good 11.1% |
| Immigrants | Moldova | 72.8 /100 | #154 | Good 11.1% |
| Immigrants | Middle Africa | 70.9 /100 | #155 | Good 11.1% |
| Russians | 69.8 /100 | #156 | Good 11.1% |
| Immigrants | Western Africa | 69.2 /100 | #157 | Good 11.1% |
| Latvians | 68.1 /100 | #158 | Good 11.1% |
| Guatemalans | 67.2 /100 | #159 | Good 11.1% |
| Albanians | 66.5 /100 | #160 | Good 11.1% |
Demographics Similar to Immigrants from Western Asia by Male Disability
In terms of male disability, the demographic groups most similar to Immigrants from Western Asia are Immigrants from Nicaragua (10.6%, a difference of 0.0%), Immigrants from Morocco (10.6%, a difference of 0.050%), Immigrants from Vietnam (10.6%, a difference of 0.070%), Immigrants from Ireland (10.6%, a difference of 0.090%), and Immigrants from France (10.6%, a difference of 0.090%).
| Demographics | Rating | Rank | Male Disability |
| Immigrants | Chile | 98.3 /100 | #81 | Exceptional 10.6% |
| Immigrants | Guyana | 98.2 /100 | #82 | Exceptional 10.6% |
| Immigrants | Poland | 98.1 /100 | #83 | Exceptional 10.6% |
| Bulgarians | 98.1 /100 | #84 | Exceptional 10.6% |
| Sri Lankans | 97.9 /100 | #85 | Exceptional 10.6% |
| Immigrants | Ireland | 97.9 /100 | #86 | Exceptional 10.6% |
| Immigrants | Vietnam | 97.9 /100 | #87 | Exceptional 10.6% |
| Immigrants | Western Asia | 97.8 /100 | #88 | Exceptional 10.6% |
| Immigrants | Nicaragua | 97.8 /100 | #89 | Exceptional 10.6% |
| Immigrants | Morocco | 97.7 /100 | #90 | Exceptional 10.6% |
| Immigrants | France | 97.6 /100 | #91 | Exceptional 10.6% |
| Palestinians | 97.4 /100 | #92 | Exceptional 10.7% |
| Immigrants | St. Vincent and the Grenadines | 97.1 /100 | #93 | Exceptional 10.7% |
| Immigrants | Sweden | 96.9 /100 | #94 | Exceptional 10.7% |
| Chileans | 96.9 /100 | #95 | Exceptional 10.7% |