Vietnamese vs Immigrants from Western Asia No Vehicles in Household
COMPARE
Vietnamese
Immigrants from Western Asia
No Vehicles in Household
No Vehicles in Household Comparison
Vietnamese
Immigrants from Western Asia
26.2%
NO VEHICLES IN HOUSEHOLD
0.0/ 100
METRIC RATING
336th/ 347
METRIC RANK
11.0%
NO VEHICLES IN HOUSEHOLD
13.9/ 100
METRIC RATING
212th/ 347
METRIC RANK
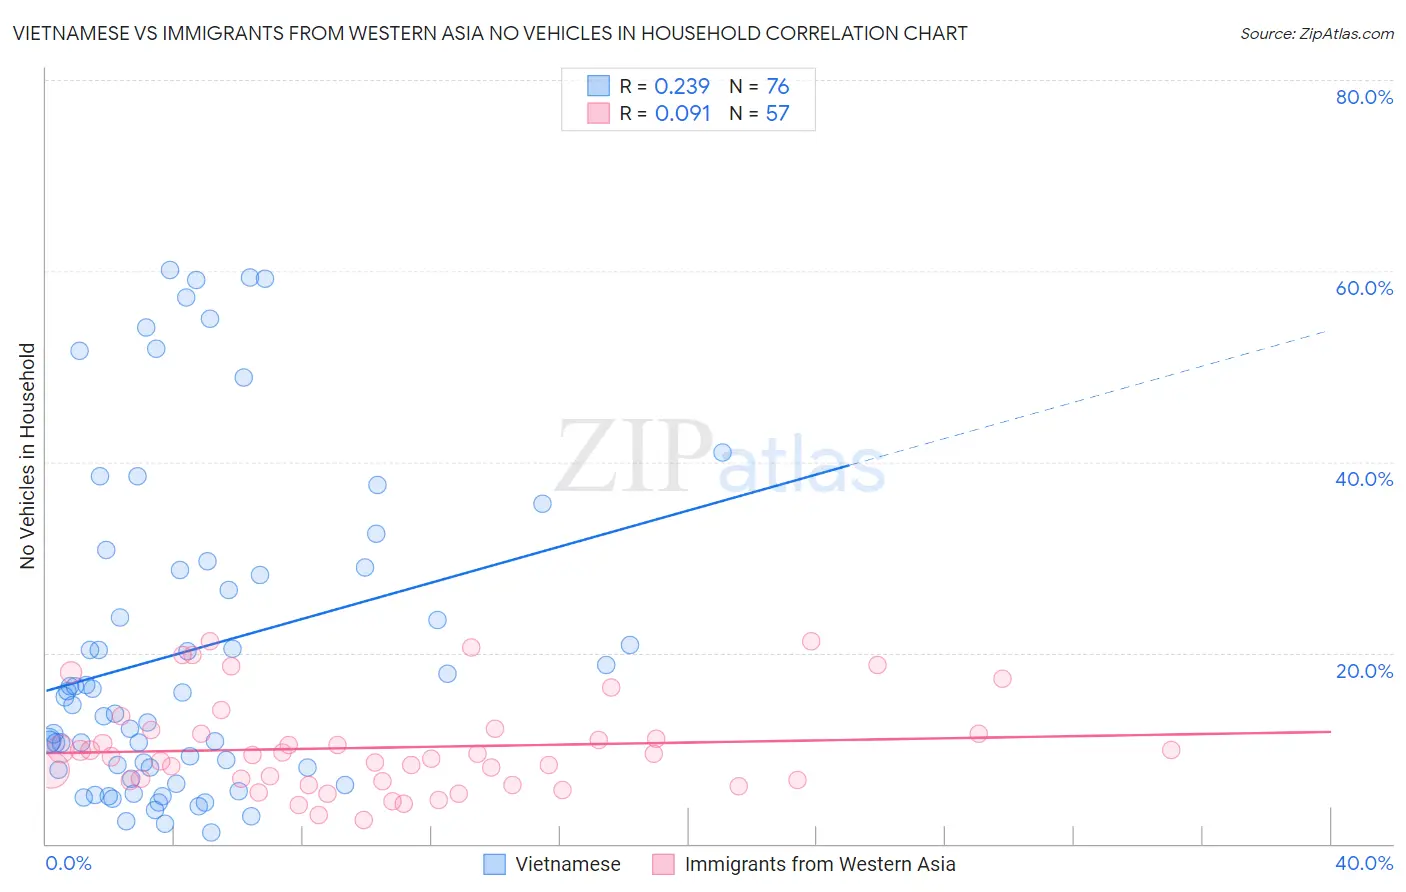
Vietnamese vs Immigrants from Western Asia No Vehicles in Household Correlation Chart
The statistical analysis conducted on geographies consisting of 170,596,968 people shows a weak positive correlation between the proportion of Vietnamese and percentage of households with no vehicle available in the United States with a correlation coefficient (R) of 0.239 and weighted average of 26.2%. Similarly, the statistical analysis conducted on geographies consisting of 403,545,957 people shows a slight positive correlation between the proportion of Immigrants from Western Asia and percentage of households with no vehicle available in the United States with a correlation coefficient (R) of 0.091 and weighted average of 11.0%, a difference of 137.4%.
No Vehicles in Household Correlation Summary
| Measurement | Vietnamese | Immigrants from Western Asia |
| Minimum | 1.2% | 2.5% |
| Maximum | 60.1% | 21.2% |
| Range | 58.8% | 18.8% |
| Mean | 20.3% | 10.1% |
| Median | 15.0% | 9.3% |
| Interquartile 25% (IQ1) | 7.8% | 6.6% |
| Interquartile 75% (IQ3) | 28.8% | 11.8% |
| Interquartile Range (IQR) | 21.0% | 5.2% |
| Standard Deviation (Sample) | 16.9% | 4.9% |
| Standard Deviation (Population) | 16.8% | 4.9% |
Similar Demographics by No Vehicles in Household
Demographics Similar to Vietnamese by No Vehicles in Household
In terms of no vehicles in household, the demographic groups most similar to Vietnamese are Barbadian (26.1%, a difference of 0.56%), Immigrants from Uzbekistan (26.7%, a difference of 1.7%), Immigrants from Bangladesh (25.8%, a difference of 1.9%), Immigrants from Trinidad and Tobago (24.6%, a difference of 6.5%), and Immigrants from Ecuador (23.8%, a difference of 10.1%).
| Demographics | Rating | Rank | No Vehicles in Household |
| Ecuadorians | 0.0 /100 | #329 | Tragic 22.8% |
| West Indians | 0.0 /100 | #330 | Tragic 23.7% |
| Trinidadians and Tobagonians | 0.0 /100 | #331 | Tragic 23.7% |
| Immigrants | Ecuador | 0.0 /100 | #332 | Tragic 23.8% |
| Immigrants | Trinidad and Tobago | 0.0 /100 | #333 | Tragic 24.6% |
| Immigrants | Bangladesh | 0.0 /100 | #334 | Tragic 25.8% |
| Barbadians | 0.0 /100 | #335 | Tragic 26.1% |
| Vietnamese | 0.0 /100 | #336 | Tragic 26.2% |
| Immigrants | Uzbekistan | 0.0 /100 | #337 | Tragic 26.7% |
| Guyanese | 0.0 /100 | #338 | Tragic 29.3% |
| Dominicans | 0.0 /100 | #339 | Tragic 29.4% |
| Immigrants | Barbados | 0.0 /100 | #340 | Tragic 29.5% |
| Immigrants | Guyana | 0.0 /100 | #341 | Tragic 29.5% |
| British West Indians | 0.0 /100 | #342 | Tragic 29.7% |
| Inupiat | 0.0 /100 | #343 | Tragic 29.9% |
Demographics Similar to Immigrants from Western Asia by No Vehicles in Household
In terms of no vehicles in household, the demographic groups most similar to Immigrants from Western Asia are Crow (11.0%, a difference of 0.090%), Apache (11.0%, a difference of 0.25%), Pennsylvania German (11.0%, a difference of 0.41%), Immigrants from Hungary (11.1%, a difference of 0.43%), and Immigrants from Italy (11.0%, a difference of 0.45%).
| Demographics | Rating | Rank | No Vehicles in Household |
| Immigrants | Chile | 15.9 /100 | #205 | Poor 11.0% |
| Somalis | 15.9 /100 | #206 | Poor 11.0% |
| Sierra Leoneans | 15.7 /100 | #207 | Poor 11.0% |
| Immigrants | Italy | 15.6 /100 | #208 | Poor 11.0% |
| Pennsylvania Germans | 15.5 /100 | #209 | Poor 11.0% |
| Apache | 14.8 /100 | #210 | Poor 11.0% |
| Crow | 14.2 /100 | #211 | Poor 11.0% |
| Immigrants | Western Asia | 13.9 /100 | #212 | Poor 11.0% |
| Immigrants | Hungary | 12.3 /100 | #213 | Poor 11.1% |
| Immigrants | Denmark | 12.1 /100 | #214 | Poor 11.1% |
| Immigrants | Sri Lanka | 10.6 /100 | #215 | Poor 11.2% |
| Immigrants | Argentina | 10.6 /100 | #216 | Poor 11.2% |
| Dutch West Indians | 10.2 /100 | #217 | Poor 11.2% |
| Immigrants | Guatemala | 10.0 /100 | #218 | Tragic 11.2% |
| Argentineans | 9.6 /100 | #219 | Tragic 11.2% |