Immigrants from North America vs Immigrants from Serbia No Vehicles in Household
COMPARE
Immigrants from North America
Immigrants from Serbia
No Vehicles in Household
No Vehicles in Household Comparison
Immigrants from North America
Immigrants from Serbia
8.7%
NO VEHICLES IN HOUSEHOLD
99.1/ 100
METRIC RATING
93rd/ 347
METRIC RANK
11.9%
NO VEHICLES IN HOUSEHOLD
1.5/ 100
METRIC RATING
252nd/ 347
METRIC RANK
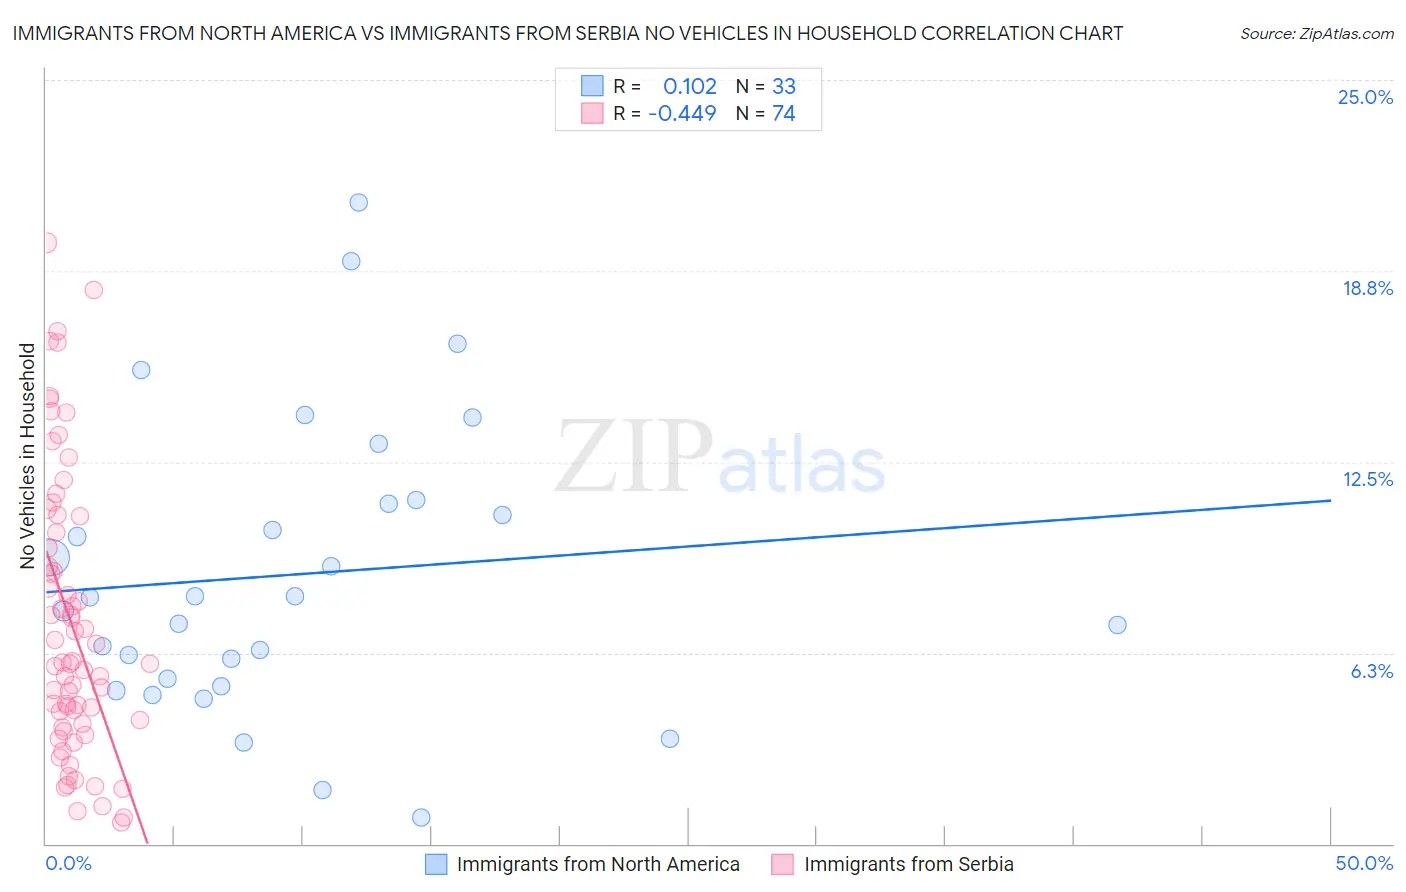
Immigrants from North America vs Immigrants from Serbia No Vehicles in Household Correlation Chart
The statistical analysis conducted on geographies consisting of 460,580,509 people shows a poor positive correlation between the proportion of Immigrants from North America and percentage of households with no vehicle available in the United States with a correlation coefficient (R) of 0.102 and weighted average of 8.7%. Similarly, the statistical analysis conducted on geographies consisting of 131,395,325 people shows a moderate negative correlation between the proportion of Immigrants from Serbia and percentage of households with no vehicle available in the United States with a correlation coefficient (R) of -0.449 and weighted average of 11.9%, a difference of 35.9%.
No Vehicles in Household Correlation Summary
| Measurement | Immigrants from North America | Immigrants from Serbia |
| Minimum | 0.85% | 0.71% |
| Maximum | 21.0% | 19.7% |
| Range | 20.1% | 19.0% |
| Mean | 8.8% | 7.2% |
| Median | 8.1% | 5.9% |
| Interquartile 25% (IQ1) | 5.3% | 3.9% |
| Interquartile 75% (IQ3) | 11.2% | 10.2% |
| Interquartile Range (IQR) | 5.9% | 6.2% |
| Standard Deviation (Sample) | 4.8% | 4.6% |
| Standard Deviation (Population) | 4.7% | 4.5% |
Similar Demographics by No Vehicles in Household
Demographics Similar to Immigrants from North America by No Vehicles in Household
In terms of no vehicles in household, the demographic groups most similar to Immigrants from North America are Immigrants from Canada (8.7%, a difference of 0.15%), Immigrants from Germany (8.7%, a difference of 0.17%), Bhutanese (8.7%, a difference of 0.36%), Immigrants from Cuba (8.7%, a difference of 0.45%), and Osage (8.7%, a difference of 0.59%).
| Demographics | Rating | Rank | No Vehicles in Household |
| Bangladeshis | 99.3 /100 | #86 | Exceptional 8.7% |
| Immigrants | England | 99.2 /100 | #87 | Exceptional 8.7% |
| Osage | 99.2 /100 | #88 | Exceptional 8.7% |
| Immigrants | Cuba | 99.2 /100 | #89 | Exceptional 8.7% |
| Bhutanese | 99.2 /100 | #90 | Exceptional 8.7% |
| Immigrants | Germany | 99.1 /100 | #91 | Exceptional 8.7% |
| Immigrants | Canada | 99.1 /100 | #92 | Exceptional 8.7% |
| Immigrants | North America | 99.1 /100 | #93 | Exceptional 8.7% |
| Austrians | 98.9 /100 | #94 | Exceptional 8.8% |
| Potawatomi | 98.8 /100 | #95 | Exceptional 8.8% |
| Immigrants | Bolivia | 98.7 /100 | #96 | Exceptional 8.9% |
| Immigrants | Central America | 98.5 /100 | #97 | Exceptional 8.9% |
| Slavs | 98.4 /100 | #98 | Exceptional 9.0% |
| Bulgarians | 98.4 /100 | #99 | Exceptional 9.0% |
| Asians | 98.3 /100 | #100 | Exceptional 9.0% |
Demographics Similar to Immigrants from Serbia by No Vehicles in Household
In terms of no vehicles in household, the demographic groups most similar to Immigrants from Serbia are Egyptian (11.9%, a difference of 0.070%), Black/African American (11.9%, a difference of 0.25%), Immigrants from Uruguay (11.9%, a difference of 0.39%), Paiute (11.8%, a difference of 0.60%), and Honduran (12.0%, a difference of 0.66%).
| Demographics | Rating | Rank | No Vehicles in Household |
| Immigrants | Honduras | 2.1 /100 | #245 | Tragic 11.8% |
| Menominee | 2.0 /100 | #246 | Tragic 11.8% |
| Immigrants | Czechoslovakia | 2.0 /100 | #247 | Tragic 11.8% |
| Immigrants | Belgium | 1.9 /100 | #248 | Tragic 11.8% |
| Immigrants | Nigeria | 1.9 /100 | #249 | Tragic 11.8% |
| Paiute | 1.8 /100 | #250 | Tragic 11.8% |
| Blacks/African Americans | 1.6 /100 | #251 | Tragic 11.9% |
| Immigrants | Serbia | 1.5 /100 | #252 | Tragic 11.9% |
| Egyptians | 1.4 /100 | #253 | Tragic 11.9% |
| Immigrants | Uruguay | 1.3 /100 | #254 | Tragic 11.9% |
| Hondurans | 1.2 /100 | #255 | Tragic 12.0% |
| Liberians | 1.2 /100 | #256 | Tragic 12.0% |
| Nigerians | 0.9 /100 | #257 | Tragic 12.1% |
| South American Indians | 0.9 /100 | #258 | Tragic 12.1% |
| Immigrants | Latvia | 0.8 /100 | #259 | Tragic 12.1% |