Immigrants from Lebanon vs Latvian 1 or more Vehicles in Household
COMPARE
Immigrants from Lebanon
Latvian
1 or more Vehicles in Household
1 or more Vehicles in Household Comparison
Immigrants from Lebanon
Latvians
91.6%
1 OR MORE VEHICLES IN HOUSEHOLD
99.6/ 100
METRIC RATING
74th/ 347
METRIC RANK
90.3%
1 OR MORE VEHICLES IN HOUSEHOLD
86.3/ 100
METRIC RATING
137th/ 347
METRIC RANK
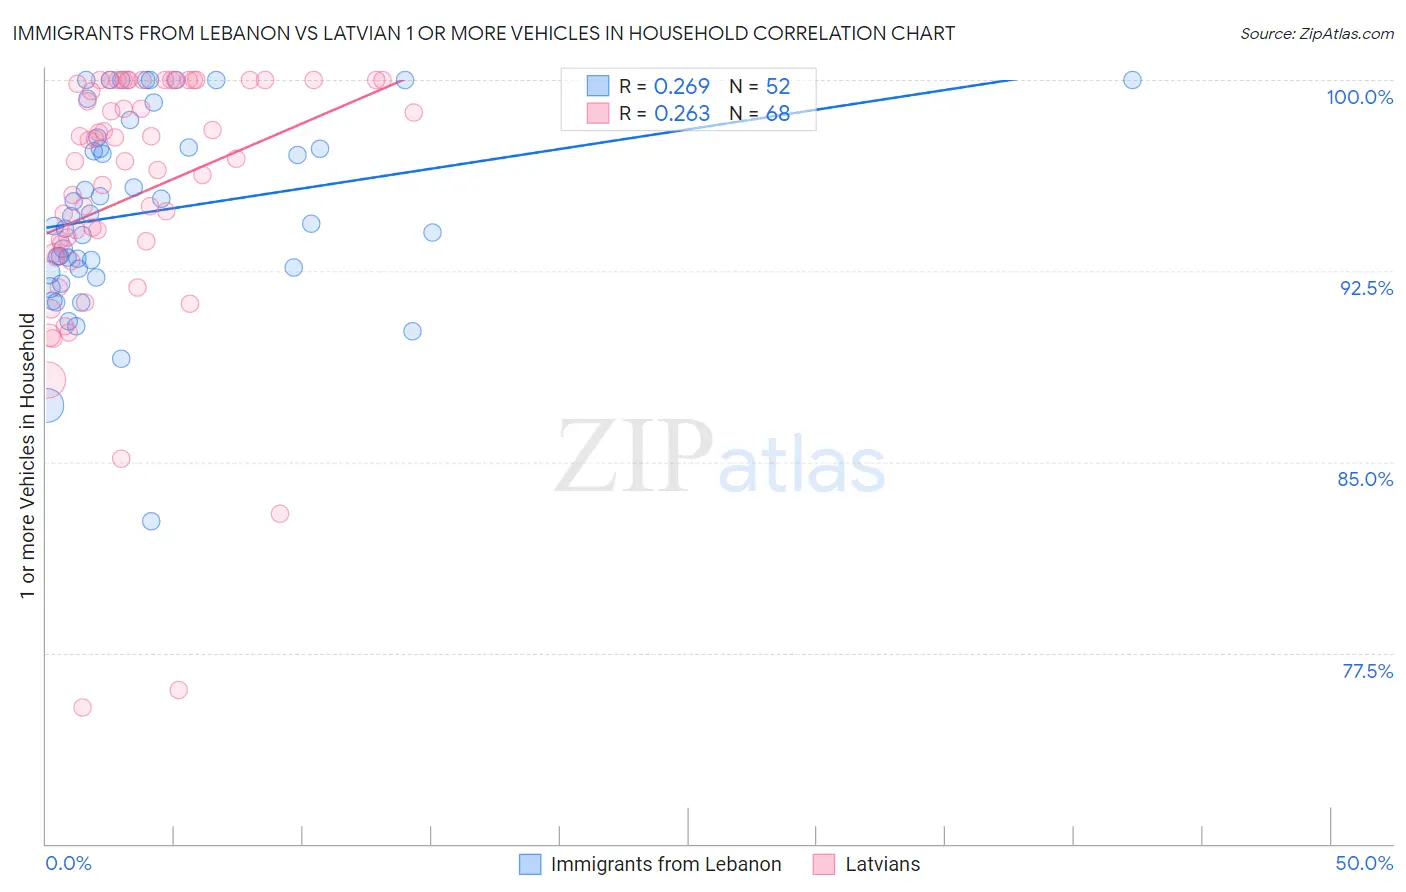
Immigrants from Lebanon vs Latvian 1 or more Vehicles in Household Correlation Chart
The statistical analysis conducted on geographies consisting of 216,991,778 people shows a weak positive correlation between the proportion of Immigrants from Lebanon and percentage of households with 1 or more vehicles available in the United States with a correlation coefficient (R) of 0.269 and weighted average of 91.6%. Similarly, the statistical analysis conducted on geographies consisting of 220,666,032 people shows a weak positive correlation between the proportion of Latvians and percentage of households with 1 or more vehicles available in the United States with a correlation coefficient (R) of 0.263 and weighted average of 90.3%, a difference of 1.5%.
1 or more Vehicles in Household Correlation Summary
| Measurement | Immigrants from Lebanon | Latvian |
| Minimum | 82.7% | 75.4% |
| Maximum | 100.0% | 100.0% |
| Range | 17.3% | 24.6% |
| Mean | 94.8% | 95.5% |
| Median | 94.5% | 96.9% |
| Interquartile 25% (IQ1) | 92.5% | 93.4% |
| Interquartile 75% (IQ3) | 97.5% | 100.0% |
| Interquartile Range (IQR) | 5.0% | 6.6% |
| Standard Deviation (Sample) | 3.8% | 5.3% |
| Standard Deviation (Population) | 3.8% | 5.2% |
Similar Demographics by 1 or more Vehicles in Household
Demographics Similar to Immigrants from Lebanon by 1 or more Vehicles in Household
In terms of 1 or more vehicles in household, the demographic groups most similar to Immigrants from Lebanon are Immigrants from Iran (91.7%, a difference of 0.030%), Polish (91.7%, a difference of 0.050%), Cajun (91.7%, a difference of 0.050%), Lithuanian (91.7%, a difference of 0.070%), and Palestinian (91.7%, a difference of 0.080%).
| Demographics | Rating | Rank | 1 or more Vehicles in Household |
| Spaniards | 99.8 /100 | #67 | Exceptional 91.8% |
| Immigrants | Scotland | 99.7 /100 | #68 | Exceptional 91.8% |
| Palestinians | 99.7 /100 | #69 | Exceptional 91.7% |
| Lithuanians | 99.7 /100 | #70 | Exceptional 91.7% |
| Poles | 99.7 /100 | #71 | Exceptional 91.7% |
| Cajuns | 99.7 /100 | #72 | Exceptional 91.7% |
| Immigrants | Iran | 99.7 /100 | #73 | Exceptional 91.7% |
| Immigrants | Lebanon | 99.6 /100 | #74 | Exceptional 91.6% |
| Portuguese | 99.5 /100 | #75 | Exceptional 91.6% |
| Cubans | 99.5 /100 | #76 | Exceptional 91.5% |
| Immigrants | Philippines | 99.4 /100 | #77 | Exceptional 91.5% |
| Iranians | 99.4 /100 | #78 | Exceptional 91.5% |
| Immigrants | South Central Asia | 99.4 /100 | #79 | Exceptional 91.5% |
| Bolivians | 99.4 /100 | #80 | Exceptional 91.5% |
| Immigrants | South Eastern Asia | 99.3 /100 | #81 | Exceptional 91.4% |
Demographics Similar to Latvians by 1 or more Vehicles in Household
In terms of 1 or more vehicles in household, the demographic groups most similar to Latvians are Syrian (90.3%, a difference of 0.0%), Hungarian (90.3%, a difference of 0.010%), Kenyan (90.4%, a difference of 0.020%), Immigrants from Oceania (90.4%, a difference of 0.020%), and Estonian (90.3%, a difference of 0.020%).
| Demographics | Rating | Rank | 1 or more Vehicles in Household |
| Nicaraguans | 88.8 /100 | #130 | Excellent 90.4% |
| Immigrants | Kenya | 88.5 /100 | #131 | Excellent 90.4% |
| Immigrants | South Africa | 88.1 /100 | #132 | Excellent 90.4% |
| Immigrants | Syria | 87.5 /100 | #133 | Excellent 90.4% |
| Kenyans | 87.0 /100 | #134 | Excellent 90.4% |
| Immigrants | Oceania | 86.9 /100 | #135 | Excellent 90.4% |
| Hungarians | 86.5 /100 | #136 | Excellent 90.3% |
| Latvians | 86.3 /100 | #137 | Excellent 90.3% |
| Syrians | 86.3 /100 | #138 | Excellent 90.3% |
| Estonians | 85.6 /100 | #139 | Excellent 90.3% |
| Sudanese | 85.2 /100 | #140 | Excellent 90.3% |
| Immigrants | Moldova | 83.1 /100 | #141 | Excellent 90.2% |
| Immigrants | Lithuania | 83.0 /100 | #142 | Excellent 90.2% |
| Immigrants | Bahamas | 81.5 /100 | #143 | Excellent 90.2% |
| Immigrants | Zimbabwe | 81.5 /100 | #144 | Excellent 90.2% |