Immigrants from Lebanon vs Immigrants from Austria 1 or more Vehicles in Household
COMPARE
Immigrants from Lebanon
Immigrants from Austria
1 or more Vehicles in Household
1 or more Vehicles in Household Comparison
Immigrants from Lebanon
Immigrants from Austria
91.6%
1 OR MORE VEHICLES IN HOUSEHOLD
99.6/ 100
METRIC RATING
74th/ 347
METRIC RANK
89.9%
1 OR MORE VEHICLES IN HOUSEHOLD
65.5/ 100
METRIC RATING
163rd/ 347
METRIC RANK
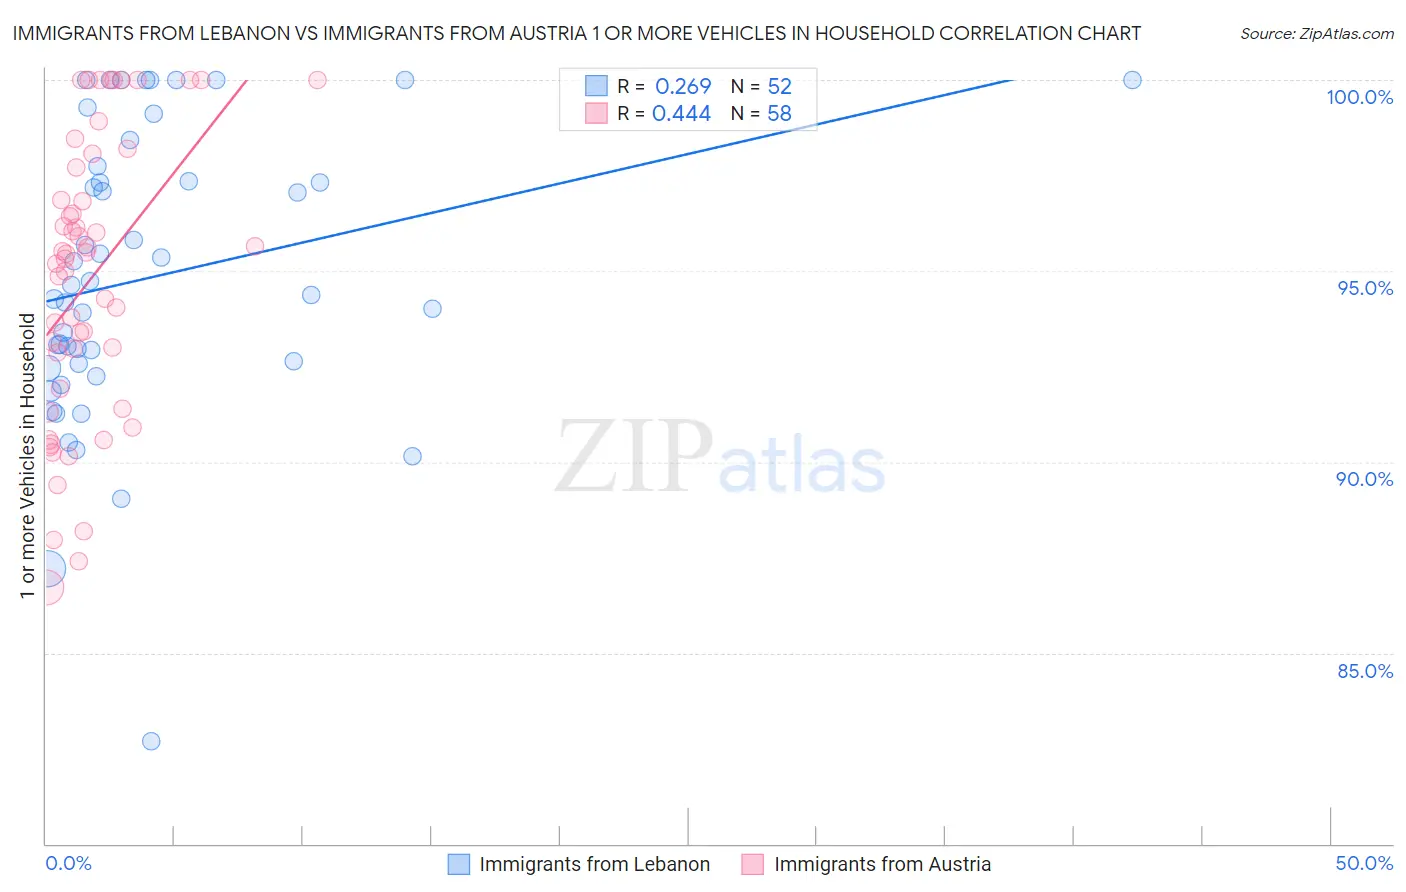
Immigrants from Lebanon vs Immigrants from Austria 1 or more Vehicles in Household Correlation Chart
The statistical analysis conducted on geographies consisting of 216,991,778 people shows a weak positive correlation between the proportion of Immigrants from Lebanon and percentage of households with 1 or more vehicles available in the United States with a correlation coefficient (R) of 0.269 and weighted average of 91.6%. Similarly, the statistical analysis conducted on geographies consisting of 167,940,062 people shows a moderate positive correlation between the proportion of Immigrants from Austria and percentage of households with 1 or more vehicles available in the United States with a correlation coefficient (R) of 0.444 and weighted average of 89.9%, a difference of 1.9%.
1 or more Vehicles in Household Correlation Summary
| Measurement | Immigrants from Lebanon | Immigrants from Austria |
| Minimum | 82.7% | 86.7% |
| Maximum | 100.0% | 100.0% |
| Range | 17.3% | 13.3% |
| Mean | 94.8% | 94.8% |
| Median | 94.5% | 95.4% |
| Interquartile 25% (IQ1) | 92.5% | 91.9% |
| Interquartile 75% (IQ3) | 97.5% | 97.7% |
| Interquartile Range (IQR) | 5.0% | 5.8% |
| Standard Deviation (Sample) | 3.8% | 3.7% |
| Standard Deviation (Population) | 3.8% | 3.7% |
Similar Demographics by 1 or more Vehicles in Household
Demographics Similar to Immigrants from Lebanon by 1 or more Vehicles in Household
In terms of 1 or more vehicles in household, the demographic groups most similar to Immigrants from Lebanon are Immigrants from Iran (91.7%, a difference of 0.030%), Polish (91.7%, a difference of 0.050%), Cajun (91.7%, a difference of 0.050%), Lithuanian (91.7%, a difference of 0.070%), and Palestinian (91.7%, a difference of 0.080%).
| Demographics | Rating | Rank | 1 or more Vehicles in Household |
| Spaniards | 99.8 /100 | #67 | Exceptional 91.8% |
| Immigrants | Scotland | 99.7 /100 | #68 | Exceptional 91.8% |
| Palestinians | 99.7 /100 | #69 | Exceptional 91.7% |
| Lithuanians | 99.7 /100 | #70 | Exceptional 91.7% |
| Poles | 99.7 /100 | #71 | Exceptional 91.7% |
| Cajuns | 99.7 /100 | #72 | Exceptional 91.7% |
| Immigrants | Iran | 99.7 /100 | #73 | Exceptional 91.7% |
| Immigrants | Lebanon | 99.6 /100 | #74 | Exceptional 91.6% |
| Portuguese | 99.5 /100 | #75 | Exceptional 91.6% |
| Cubans | 99.5 /100 | #76 | Exceptional 91.5% |
| Immigrants | Philippines | 99.4 /100 | #77 | Exceptional 91.5% |
| Iranians | 99.4 /100 | #78 | Exceptional 91.5% |
| Immigrants | South Central Asia | 99.4 /100 | #79 | Exceptional 91.5% |
| Bolivians | 99.4 /100 | #80 | Exceptional 91.5% |
| Immigrants | South Eastern Asia | 99.3 /100 | #81 | Exceptional 91.4% |
Demographics Similar to Immigrants from Austria by 1 or more Vehicles in Household
In terms of 1 or more vehicles in household, the demographic groups most similar to Immigrants from Austria are Spanish American Indian (89.9%, a difference of 0.030%), Comanche (89.9%, a difference of 0.040%), Immigrants from Saudi Arabia (89.9%, a difference of 0.050%), Immigrants from Indonesia (90.0%, a difference of 0.060%), and Salvadoran (90.0%, a difference of 0.060%).
| Demographics | Rating | Rank | 1 or more Vehicles in Household |
| Australians | 72.4 /100 | #156 | Good 90.0% |
| Immigrants | Congo | 71.2 /100 | #157 | Good 90.0% |
| Brazilians | 71.0 /100 | #158 | Good 90.0% |
| South Africans | 69.7 /100 | #159 | Good 90.0% |
| Immigrants | Indonesia | 68.8 /100 | #160 | Good 90.0% |
| Salvadorans | 68.7 /100 | #161 | Good 90.0% |
| Spanish American Indians | 67.0 /100 | #162 | Good 89.9% |
| Immigrants | Austria | 65.5 /100 | #163 | Good 89.9% |
| Comanche | 63.4 /100 | #164 | Good 89.9% |
| Immigrants | Saudi Arabia | 62.6 /100 | #165 | Good 89.9% |
| Immigrants | Middle Africa | 62.2 /100 | #166 | Good 89.9% |
| Immigrants | Latin America | 60.3 /100 | #167 | Good 89.8% |
| Immigrants | Cambodia | 60.1 /100 | #168 | Good 89.8% |
| Natives/Alaskans | 59.5 /100 | #169 | Average 89.8% |
| Immigrants | Costa Rica | 57.6 /100 | #170 | Average 89.8% |