Immigrants from Kenya vs White/Caucasian No Vehicles in Household
COMPARE
Immigrants from Kenya
White/Caucasian
No Vehicles in Household
No Vehicles in Household Comparison
Immigrants from Kenya
Whites/Caucasians
9.6%
NO VEHICLES IN HOUSEHOLD
89.7/ 100
METRIC RATING
127th/ 347
METRIC RANK
7.0%
NO VEHICLES IN HOUSEHOLD
100.0/ 100
METRIC RATING
15th/ 347
METRIC RANK
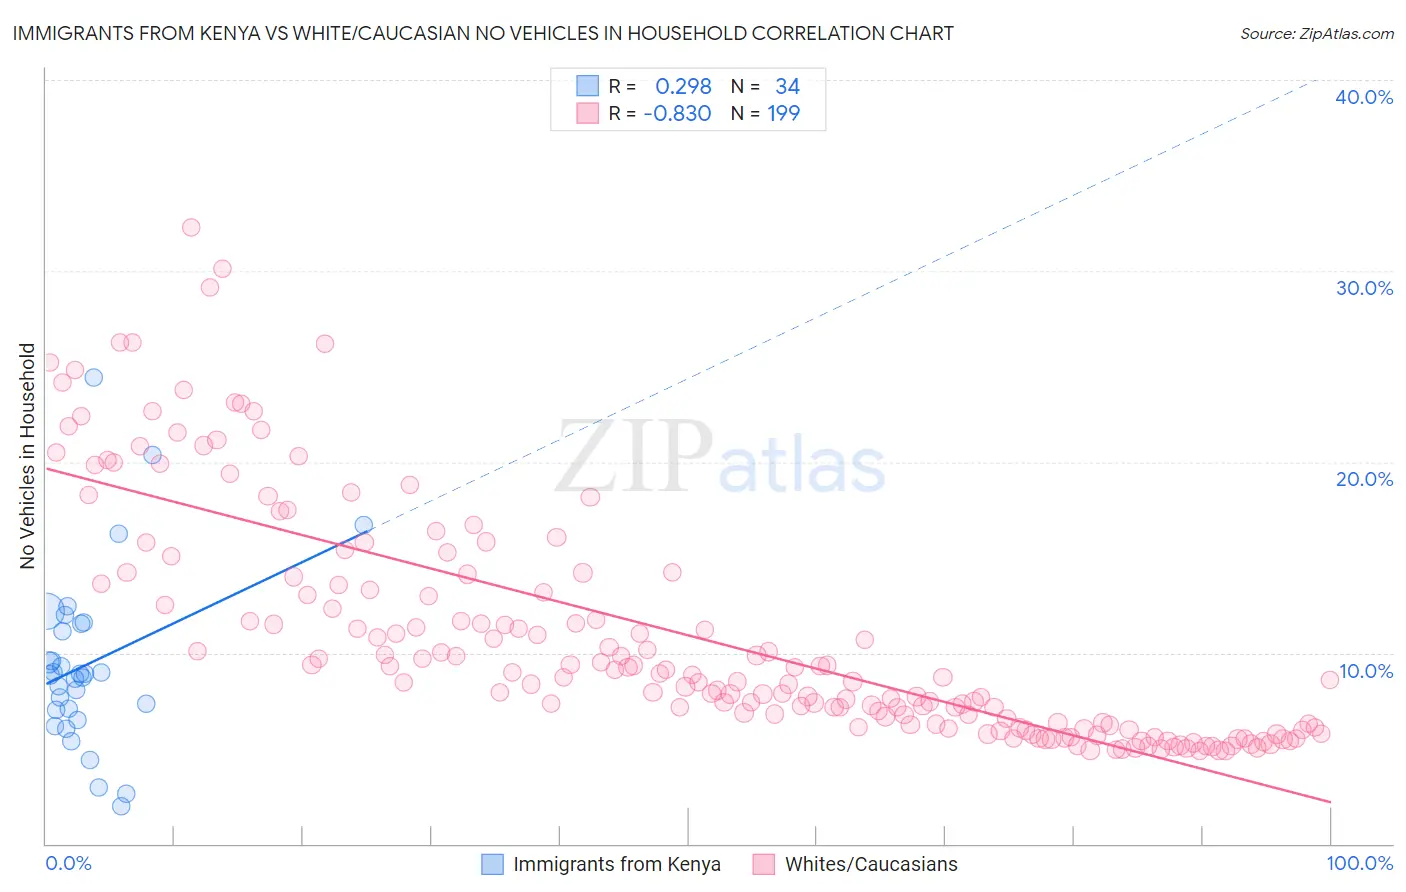
Immigrants from Kenya vs White/Caucasian No Vehicles in Household Correlation Chart
The statistical analysis conducted on geographies consisting of 217,879,902 people shows a weak positive correlation between the proportion of Immigrants from Kenya and percentage of households with no vehicle available in the United States with a correlation coefficient (R) of 0.298 and weighted average of 9.6%. Similarly, the statistical analysis conducted on geographies consisting of 564,577,305 people shows a very strong negative correlation between the proportion of Whites/Caucasians and percentage of households with no vehicle available in the United States with a correlation coefficient (R) of -0.830 and weighted average of 7.0%, a difference of 37.0%.
No Vehicles in Household Correlation Summary
| Measurement | Immigrants from Kenya | White/Caucasian |
| Minimum | 2.0% | 4.8% |
| Maximum | 24.4% | 32.3% |
| Range | 22.4% | 27.4% |
| Mean | 9.4% | 10.9% |
| Median | 8.9% | 8.7% |
| Interquartile 25% (IQ1) | 7.0% | 6.2% |
| Interquartile 75% (IQ3) | 11.5% | 13.6% |
| Interquartile Range (IQR) | 4.5% | 7.4% |
| Standard Deviation (Sample) | 4.7% | 6.1% |
| Standard Deviation (Population) | 4.6% | 6.1% |
Similar Demographics by No Vehicles in Household
Demographics Similar to Immigrants from Kenya by No Vehicles in Household
In terms of no vehicles in household, the demographic groups most similar to Immigrants from Kenya are Immigrants from Syria (9.6%, a difference of 0.080%), Nicaraguan (9.7%, a difference of 0.11%), Icelander (9.6%, a difference of 0.18%), Immigrants from Cameroon (9.6%, a difference of 0.35%), and Burmese (9.7%, a difference of 0.36%).
| Demographics | Rating | Rank | No Vehicles in Household |
| Immigrants | Thailand | 92.6 /100 | #120 | Exceptional 9.5% |
| Puget Sound Salish | 92.4 /100 | #121 | Exceptional 9.5% |
| Costa Ricans | 92.3 /100 | #122 | Exceptional 9.5% |
| Blackfeet | 91.4 /100 | #123 | Exceptional 9.6% |
| Immigrants | Korea | 90.9 /100 | #124 | Exceptional 9.6% |
| Immigrants | Cameroon | 90.6 /100 | #125 | Exceptional 9.6% |
| Icelanders | 90.2 /100 | #126 | Exceptional 9.6% |
| Immigrants | Kenya | 89.7 /100 | #127 | Excellent 9.6% |
| Immigrants | Syria | 89.5 /100 | #128 | Excellent 9.6% |
| Nicaraguans | 89.5 /100 | #129 | Excellent 9.7% |
| Burmese | 88.8 /100 | #130 | Excellent 9.7% |
| Immigrants | Azores | 88.2 /100 | #131 | Excellent 9.7% |
| Kenyans | 88.0 /100 | #132 | Excellent 9.7% |
| Immigrants | Oceania | 87.1 /100 | #133 | Excellent 9.7% |
| Syrians | 87.1 /100 | #134 | Excellent 9.7% |
Demographics Similar to Whites/Caucasians by No Vehicles in Household
In terms of no vehicles in household, the demographic groups most similar to Whites/Caucasians are Mexican (7.0%, a difference of 0.13%), Scandinavian (7.0%, a difference of 0.30%), Assyrian/Chaldean/Syriac (7.0%, a difference of 0.80%), European (7.1%, a difference of 1.1%), and Welsh (7.2%, a difference of 1.7%).
| Demographics | Rating | Rank | No Vehicles in Household |
| Swedes | 100.0 /100 | #8 | Exceptional 6.8% |
| Scotch-Irish | 100.0 /100 | #9 | Exceptional 6.8% |
| Dutch | 100.0 /100 | #10 | Exceptional 6.8% |
| Czechs | 100.0 /100 | #11 | Exceptional 6.9% |
| Assyrians/Chaldeans/Syriacs | 100.0 /100 | #12 | Exceptional 7.0% |
| Scandinavians | 100.0 /100 | #13 | Exceptional 7.0% |
| Mexicans | 100.0 /100 | #14 | Exceptional 7.0% |
| Whites/Caucasians | 100.0 /100 | #15 | Exceptional 7.0% |
| Europeans | 100.0 /100 | #16 | Exceptional 7.1% |
| Welsh | 100.0 /100 | #17 | Exceptional 7.2% |
| Tongans | 100.0 /100 | #18 | Exceptional 7.2% |
| Arapaho | 100.0 /100 | #19 | Exceptional 7.4% |
| Ottawa | 100.0 /100 | #20 | Exceptional 7.4% |
| Nepalese | 100.0 /100 | #21 | Exceptional 7.4% |
| Irish | 100.0 /100 | #22 | Exceptional 7.4% |