Immigrants from Switzerland vs White/Caucasian No Vehicles in Household
COMPARE
Immigrants from Switzerland
White/Caucasian
No Vehicles in Household
No Vehicles in Household Comparison
Immigrants from Switzerland
Whites/Caucasians
12.3%
NO VEHICLES IN HOUSEHOLD
0.5/ 100
METRIC RATING
264th/ 347
METRIC RANK
7.0%
NO VEHICLES IN HOUSEHOLD
100.0/ 100
METRIC RATING
15th/ 347
METRIC RANK
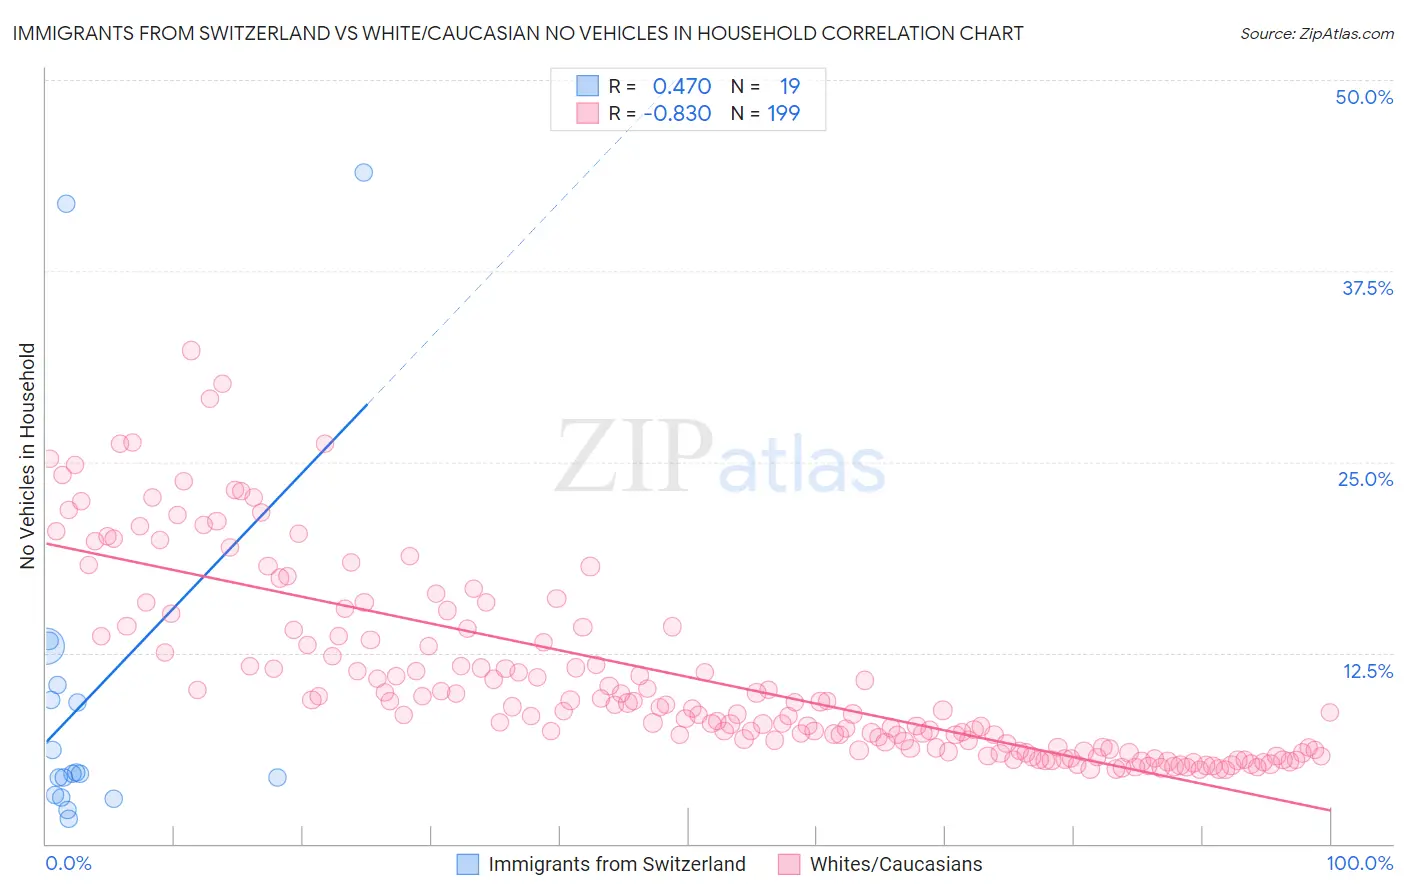
Immigrants from Switzerland vs White/Caucasian No Vehicles in Household Correlation Chart
The statistical analysis conducted on geographies consisting of 147,956,430 people shows a moderate positive correlation between the proportion of Immigrants from Switzerland and percentage of households with no vehicle available in the United States with a correlation coefficient (R) of 0.470 and weighted average of 12.3%. Similarly, the statistical analysis conducted on geographies consisting of 564,577,305 people shows a very strong negative correlation between the proportion of Whites/Caucasians and percentage of households with no vehicle available in the United States with a correlation coefficient (R) of -0.830 and weighted average of 7.0%, a difference of 74.7%.
No Vehicles in Household Correlation Summary
| Measurement | Immigrants from Switzerland | White/Caucasian |
| Minimum | 1.6% | 4.8% |
| Maximum | 43.9% | 32.3% |
| Range | 42.3% | 27.4% |
| Mean | 9.9% | 10.9% |
| Median | 4.6% | 8.7% |
| Interquartile 25% (IQ1) | 3.2% | 6.2% |
| Interquartile 75% (IQ3) | 10.4% | 13.6% |
| Interquartile Range (IQR) | 7.3% | 7.4% |
| Standard Deviation (Sample) | 12.2% | 6.1% |
| Standard Deviation (Population) | 11.8% | 6.1% |
Similar Demographics by No Vehicles in Household
Demographics Similar to Immigrants from Switzerland by No Vehicles in Household
In terms of no vehicles in household, the demographic groups most similar to Immigrants from Switzerland are African (12.3%, a difference of 0.25%), Immigrants from Egypt (12.2%, a difference of 0.46%), Immigrants from Liberia (12.2%, a difference of 0.61%), Subsaharan African (12.2%, a difference of 0.69%), and Macedonian (12.2%, a difference of 1.1%).
| Demographics | Rating | Rank | No Vehicles in Household |
| Nigerians | 0.9 /100 | #257 | Tragic 12.1% |
| South American Indians | 0.9 /100 | #258 | Tragic 12.1% |
| Immigrants | Latvia | 0.8 /100 | #259 | Tragic 12.1% |
| Macedonians | 0.7 /100 | #260 | Tragic 12.2% |
| Sub-Saharan Africans | 0.6 /100 | #261 | Tragic 12.2% |
| Immigrants | Liberia | 0.6 /100 | #262 | Tragic 12.2% |
| Immigrants | Egypt | 0.6 /100 | #263 | Tragic 12.2% |
| Immigrants | Switzerland | 0.5 /100 | #264 | Tragic 12.3% |
| Africans | 0.4 /100 | #265 | Tragic 12.3% |
| Israelis | 0.3 /100 | #266 | Tragic 12.4% |
| Immigrants | Europe | 0.3 /100 | #267 | Tragic 12.5% |
| Immigrants | Africa | 0.2 /100 | #268 | Tragic 12.5% |
| Panamanians | 0.2 /100 | #269 | Tragic 12.5% |
| Immigrants | Northern Africa | 0.2 /100 | #270 | Tragic 12.6% |
| Immigrants | Morocco | 0.2 /100 | #271 | Tragic 12.6% |
Demographics Similar to Whites/Caucasians by No Vehicles in Household
In terms of no vehicles in household, the demographic groups most similar to Whites/Caucasians are Mexican (7.0%, a difference of 0.13%), Scandinavian (7.0%, a difference of 0.30%), Assyrian/Chaldean/Syriac (7.0%, a difference of 0.80%), European (7.1%, a difference of 1.1%), and Welsh (7.2%, a difference of 1.7%).
| Demographics | Rating | Rank | No Vehicles in Household |
| Swedes | 100.0 /100 | #8 | Exceptional 6.8% |
| Scotch-Irish | 100.0 /100 | #9 | Exceptional 6.8% |
| Dutch | 100.0 /100 | #10 | Exceptional 6.8% |
| Czechs | 100.0 /100 | #11 | Exceptional 6.9% |
| Assyrians/Chaldeans/Syriacs | 100.0 /100 | #12 | Exceptional 7.0% |
| Scandinavians | 100.0 /100 | #13 | Exceptional 7.0% |
| Mexicans | 100.0 /100 | #14 | Exceptional 7.0% |
| Whites/Caucasians | 100.0 /100 | #15 | Exceptional 7.0% |
| Europeans | 100.0 /100 | #16 | Exceptional 7.1% |
| Welsh | 100.0 /100 | #17 | Exceptional 7.2% |
| Tongans | 100.0 /100 | #18 | Exceptional 7.2% |
| Arapaho | 100.0 /100 | #19 | Exceptional 7.4% |
| Ottawa | 100.0 /100 | #20 | Exceptional 7.4% |
| Nepalese | 100.0 /100 | #21 | Exceptional 7.4% |
| Irish | 100.0 /100 | #22 | Exceptional 7.4% |