Immigrants from Kenya vs Indian (Asian) No Vehicles in Household
COMPARE
Immigrants from Kenya
Indian (Asian)
No Vehicles in Household
No Vehicles in Household Comparison
Immigrants from Kenya
Indians (Asian)
9.6%
NO VEHICLES IN HOUSEHOLD
89.7/ 100
METRIC RATING
127th/ 347
METRIC RANK
14.1%
NO VEHICLES IN HOUSEHOLD
0.0/ 100
METRIC RATING
290th/ 347
METRIC RANK
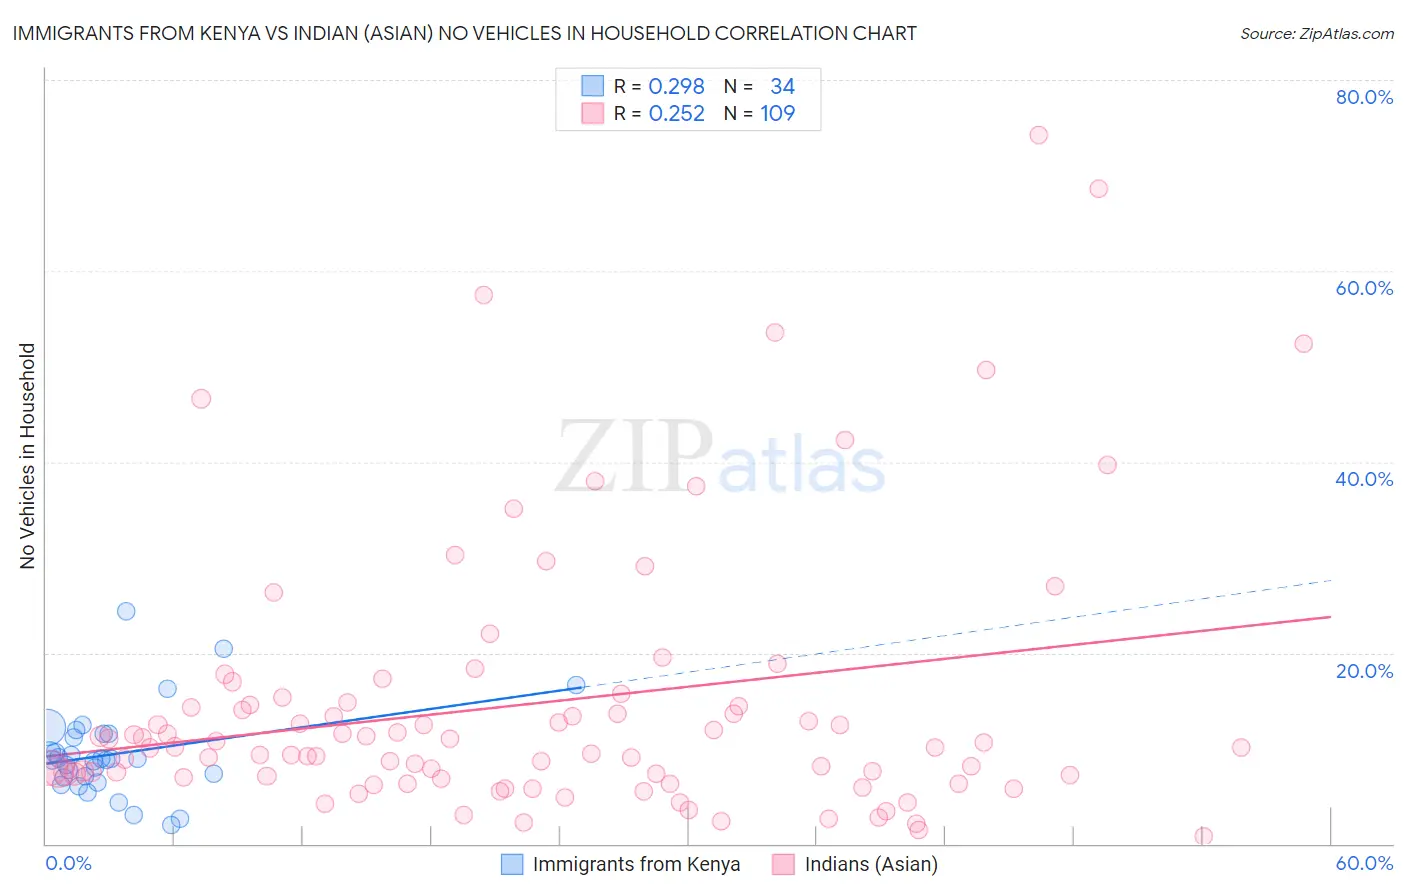
Immigrants from Kenya vs Indian (Asian) No Vehicles in Household Correlation Chart
The statistical analysis conducted on geographies consisting of 217,879,902 people shows a weak positive correlation between the proportion of Immigrants from Kenya and percentage of households with no vehicle available in the United States with a correlation coefficient (R) of 0.298 and weighted average of 9.6%. Similarly, the statistical analysis conducted on geographies consisting of 492,881,185 people shows a weak positive correlation between the proportion of Indians (Asian) and percentage of households with no vehicle available in the United States with a correlation coefficient (R) of 0.252 and weighted average of 14.1%, a difference of 45.9%.
No Vehicles in Household Correlation Summary
| Measurement | Immigrants from Kenya | Indian (Asian) |
| Minimum | 2.0% | 0.81% |
| Maximum | 24.4% | 74.2% |
| Range | 22.4% | 73.4% |
| Mean | 9.4% | 14.7% |
| Median | 8.9% | 10.1% |
| Interquartile 25% (IQ1) | 7.0% | 7.0% |
| Interquartile 75% (IQ3) | 11.5% | 14.7% |
| Interquartile Range (IQR) | 4.5% | 7.7% |
| Standard Deviation (Sample) | 4.7% | 14.2% |
| Standard Deviation (Population) | 4.6% | 14.1% |
Similar Demographics by No Vehicles in Household
Demographics Similar to Immigrants from Kenya by No Vehicles in Household
In terms of no vehicles in household, the demographic groups most similar to Immigrants from Kenya are Immigrants from Syria (9.6%, a difference of 0.080%), Nicaraguan (9.7%, a difference of 0.11%), Icelander (9.6%, a difference of 0.18%), Immigrants from Cameroon (9.6%, a difference of 0.35%), and Burmese (9.7%, a difference of 0.36%).
| Demographics | Rating | Rank | No Vehicles in Household |
| Immigrants | Thailand | 92.6 /100 | #120 | Exceptional 9.5% |
| Puget Sound Salish | 92.4 /100 | #121 | Exceptional 9.5% |
| Costa Ricans | 92.3 /100 | #122 | Exceptional 9.5% |
| Blackfeet | 91.4 /100 | #123 | Exceptional 9.6% |
| Immigrants | Korea | 90.9 /100 | #124 | Exceptional 9.6% |
| Immigrants | Cameroon | 90.6 /100 | #125 | Exceptional 9.6% |
| Icelanders | 90.2 /100 | #126 | Exceptional 9.6% |
| Immigrants | Kenya | 89.7 /100 | #127 | Excellent 9.6% |
| Immigrants | Syria | 89.5 /100 | #128 | Excellent 9.6% |
| Nicaraguans | 89.5 /100 | #129 | Excellent 9.7% |
| Burmese | 88.8 /100 | #130 | Excellent 9.7% |
| Immigrants | Azores | 88.2 /100 | #131 | Excellent 9.7% |
| Kenyans | 88.0 /100 | #132 | Excellent 9.7% |
| Immigrants | Oceania | 87.1 /100 | #133 | Excellent 9.7% |
| Syrians | 87.1 /100 | #134 | Excellent 9.7% |
Demographics Similar to Indians (Asian) by No Vehicles in Household
In terms of no vehicles in household, the demographic groups most similar to Indians (Asian) are Okinawan (14.1%, a difference of 0.0%), Pima (14.1%, a difference of 0.49%), Immigrants from Jamaica (14.2%, a difference of 1.1%), Immigrants from Australia (13.8%, a difference of 1.7%), and Belizean (14.3%, a difference of 1.9%).
| Demographics | Rating | Rank | No Vehicles in Household |
| Immigrants | Kazakhstan | 0.0 /100 | #283 | Tragic 13.6% |
| Immigrants | Malaysia | 0.0 /100 | #284 | Tragic 13.6% |
| Immigrants | Eastern Europe | 0.0 /100 | #285 | Tragic 13.6% |
| Colville | 0.0 /100 | #286 | Tragic 13.7% |
| Immigrants | Ireland | 0.0 /100 | #287 | Tragic 13.7% |
| Hopi | 0.0 /100 | #288 | Tragic 13.7% |
| Immigrants | Australia | 0.0 /100 | #289 | Tragic 13.8% |
| Indians (Asian) | 0.0 /100 | #290 | Tragic 14.1% |
| Okinawans | 0.0 /100 | #291 | Tragic 14.1% |
| Pima | 0.0 /100 | #292 | Tragic 14.1% |
| Immigrants | Jamaica | 0.0 /100 | #293 | Tragic 14.2% |
| Belizeans | 0.0 /100 | #294 | Tragic 14.3% |
| Paraguayans | 0.0 /100 | #295 | Tragic 14.4% |
| Immigrants | Spain | 0.0 /100 | #296 | Tragic 14.5% |
| Immigrants | Panama | 0.0 /100 | #297 | Tragic 14.6% |