Immigrants from Kenya vs Immigrants from Nicaragua No Vehicles in Household
COMPARE
Immigrants from Kenya
Immigrants from Nicaragua
No Vehicles in Household
No Vehicles in Household Comparison
Immigrants from Kenya
Immigrants from Nicaragua
9.6%
NO VEHICLES IN HOUSEHOLD
89.7/ 100
METRIC RATING
127th/ 347
METRIC RANK
9.9%
NO VEHICLES IN HOUSEHOLD
79.8/ 100
METRIC RATING
147th/ 347
METRIC RANK
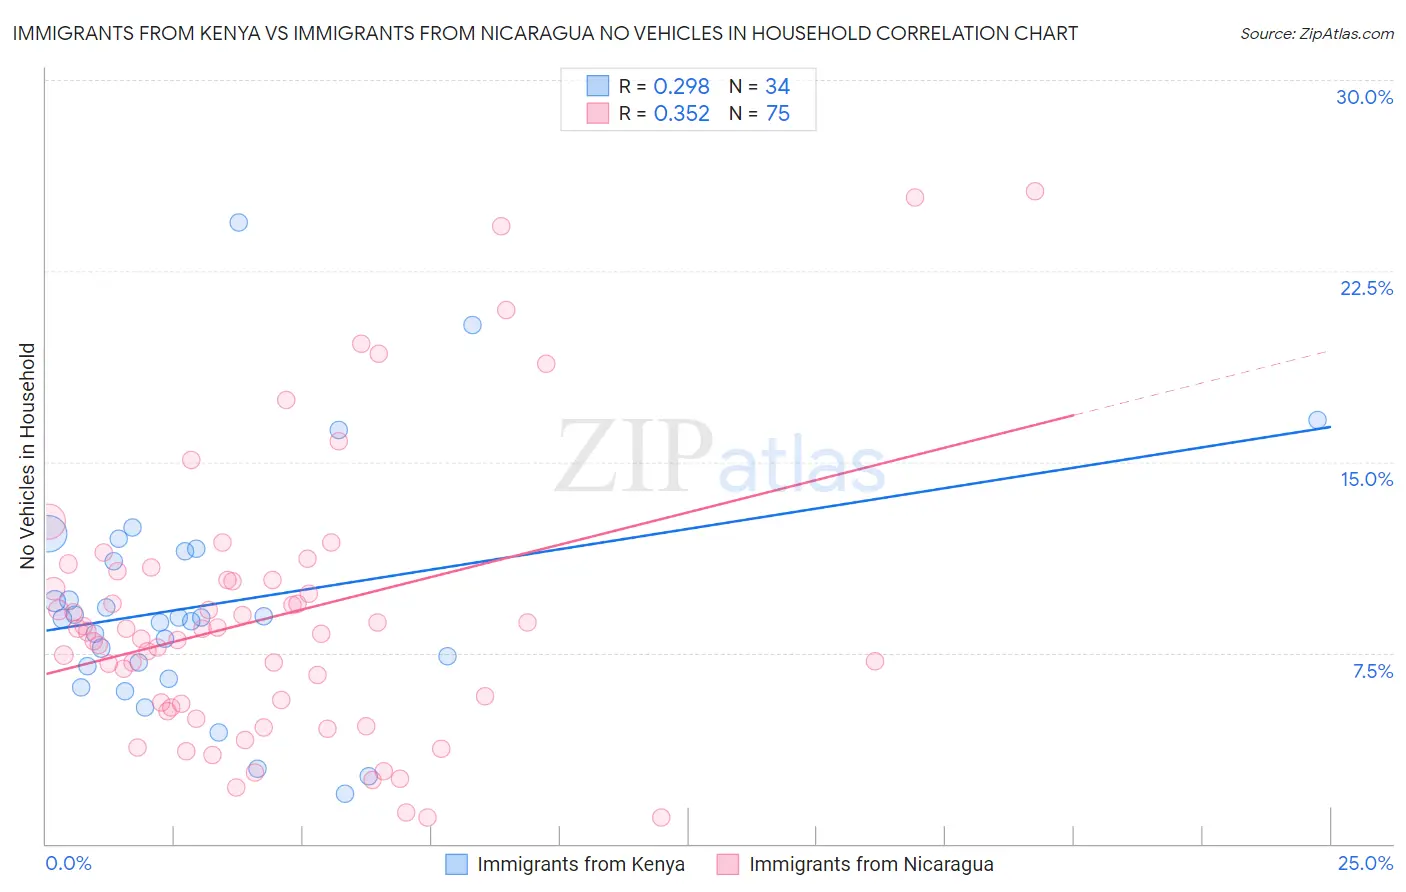
Immigrants from Kenya vs Immigrants from Nicaragua No Vehicles in Household Correlation Chart
The statistical analysis conducted on geographies consisting of 217,879,902 people shows a weak positive correlation between the proportion of Immigrants from Kenya and percentage of households with no vehicle available in the United States with a correlation coefficient (R) of 0.298 and weighted average of 9.6%. Similarly, the statistical analysis conducted on geographies consisting of 236,149,436 people shows a mild positive correlation between the proportion of Immigrants from Nicaragua and percentage of households with no vehicle available in the United States with a correlation coefficient (R) of 0.352 and weighted average of 9.9%, a difference of 2.9%.
No Vehicles in Household Correlation Summary
| Measurement | Immigrants from Kenya | Immigrants from Nicaragua |
| Minimum | 2.0% | 1.0% |
| Maximum | 24.4% | 25.6% |
| Range | 22.4% | 24.6% |
| Mean | 9.4% | 8.9% |
| Median | 8.9% | 8.3% |
| Interquartile 25% (IQ1) | 7.0% | 5.4% |
| Interquartile 75% (IQ3) | 11.5% | 10.4% |
| Interquartile Range (IQR) | 4.5% | 5.0% |
| Standard Deviation (Sample) | 4.7% | 5.4% |
| Standard Deviation (Population) | 4.6% | 5.4% |
Demographics Similar to Immigrants from Kenya and Immigrants from Nicaragua by No Vehicles in Household
In terms of no vehicles in household, the demographic groups most similar to Immigrants from Kenya are Immigrants from Syria (9.6%, a difference of 0.080%), Nicaraguan (9.7%, a difference of 0.11%), Burmese (9.7%, a difference of 0.36%), Immigrants from the Azores (9.7%, a difference of 0.57%), and Kenyan (9.7%, a difference of 0.64%). Similarly, the demographic groups most similar to Immigrants from Nicaragua are Hungarian (9.9%, a difference of 0.060%), Bahamian (9.9%, a difference of 0.28%), Chilean (9.9%, a difference of 0.31%), Immigrants from Bahamas (9.9%, a difference of 0.31%), and Immigrants from Zimbabwe (9.9%, a difference of 0.67%).
| Demographics | Rating | Rank | No Vehicles in Household |
| Immigrants | Kenya | 89.7 /100 | #127 | Excellent 9.6% |
| Immigrants | Syria | 89.5 /100 | #128 | Excellent 9.6% |
| Nicaraguans | 89.5 /100 | #129 | Excellent 9.7% |
| Burmese | 88.8 /100 | #130 | Excellent 9.7% |
| Immigrants | Azores | 88.2 /100 | #131 | Excellent 9.7% |
| Kenyans | 88.0 /100 | #132 | Excellent 9.7% |
| Immigrants | Oceania | 87.1 /100 | #133 | Excellent 9.7% |
| Syrians | 87.1 /100 | #134 | Excellent 9.7% |
| Latvians | 85.1 /100 | #135 | Excellent 9.8% |
| Immigrants | South Africa | 85.0 /100 | #136 | Excellent 9.8% |
| Immigrants | Moldova | 84.6 /100 | #137 | Excellent 9.8% |
| Estonians | 84.2 /100 | #138 | Excellent 9.8% |
| Marshallese | 84.0 /100 | #139 | Excellent 9.8% |
| Immigrants | Lithuania | 84.0 /100 | #140 | Excellent 9.8% |
| Sudanese | 83.1 /100 | #141 | Excellent 9.8% |
| Immigrants | Zimbabwe | 82.6 /100 | #142 | Excellent 9.9% |
| Chileans | 81.2 /100 | #143 | Excellent 9.9% |
| Immigrants | Bahamas | 81.2 /100 | #144 | Excellent 9.9% |
| Bahamians | 81.0 /100 | #145 | Excellent 9.9% |
| Hungarians | 80.0 /100 | #146 | Excellent 9.9% |
| Immigrants | Nicaragua | 79.8 /100 | #147 | Good 9.9% |