American vs Immigrants from Nicaragua No Vehicles in Household
COMPARE
American
Immigrants from Nicaragua
No Vehicles in Household
No Vehicles in Household Comparison
Americans
Immigrants from Nicaragua
7.7%
NO VEHICLES IN HOUSEHOLD
100.0/ 100
METRIC RATING
29th/ 347
METRIC RANK
9.9%
NO VEHICLES IN HOUSEHOLD
79.8/ 100
METRIC RATING
147th/ 347
METRIC RANK
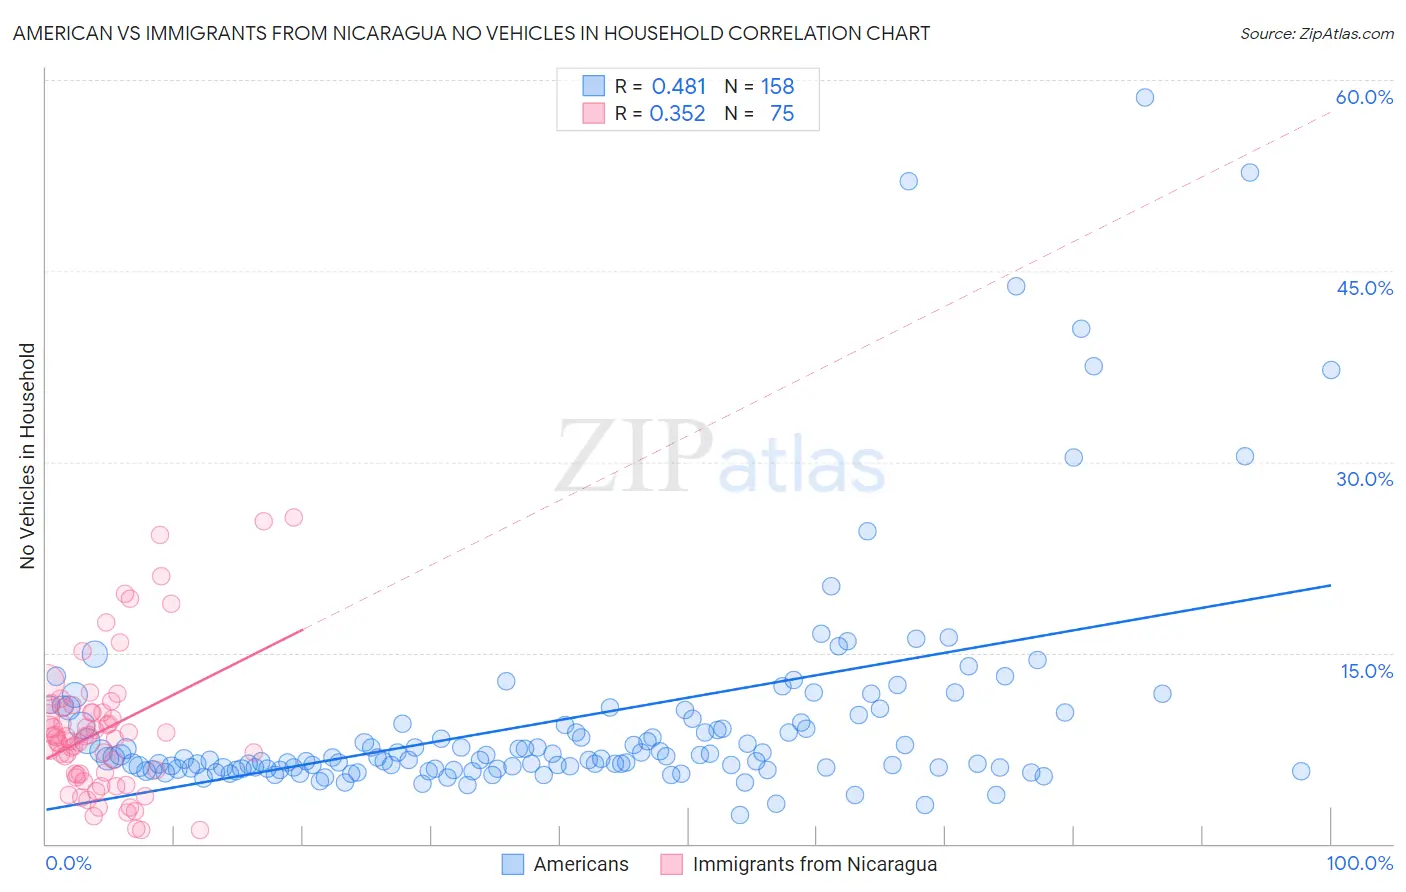
American vs Immigrants from Nicaragua No Vehicles in Household Correlation Chart
The statistical analysis conducted on geographies consisting of 575,304,149 people shows a moderate positive correlation between the proportion of Americans and percentage of households with no vehicle available in the United States with a correlation coefficient (R) of 0.481 and weighted average of 7.7%. Similarly, the statistical analysis conducted on geographies consisting of 236,149,436 people shows a mild positive correlation between the proportion of Immigrants from Nicaragua and percentage of households with no vehicle available in the United States with a correlation coefficient (R) of 0.352 and weighted average of 9.9%, a difference of 29.6%.
No Vehicles in Household Correlation Summary
| Measurement | American | Immigrants from Nicaragua |
| Minimum | 2.2% | 1.0% |
| Maximum | 58.7% | 25.6% |
| Range | 56.4% | 24.6% |
| Mean | 9.8% | 8.9% |
| Median | 6.7% | 8.3% |
| Interquartile 25% (IQ1) | 5.9% | 5.4% |
| Interquartile 75% (IQ3) | 9.5% | 10.4% |
| Interquartile Range (IQR) | 3.6% | 5.0% |
| Standard Deviation (Sample) | 9.0% | 5.4% |
| Standard Deviation (Population) | 9.0% | 5.4% |
Similar Demographics by No Vehicles in Household
Demographics Similar to Americans by No Vehicles in Household
In terms of no vehicles in household, the demographic groups most similar to Americans are Samoan (7.6%, a difference of 0.29%), Finnish (7.7%, a difference of 0.30%), Native Hawaiian (7.7%, a difference of 0.45%), Malaysian (7.7%, a difference of 0.70%), and Immigrants from Taiwan (7.7%, a difference of 0.81%).
| Demographics | Rating | Rank | No Vehicles in Household |
| Irish | 100.0 /100 | #22 | Exceptional 7.4% |
| French | 100.0 /100 | #23 | Exceptional 7.4% |
| Immigrants | Iraq | 100.0 /100 | #24 | Exceptional 7.5% |
| Yaqui | 100.0 /100 | #25 | Exceptional 7.5% |
| Sri Lankans | 100.0 /100 | #26 | Exceptional 7.6% |
| British | 100.0 /100 | #27 | Exceptional 7.6% |
| Samoans | 100.0 /100 | #28 | Exceptional 7.6% |
| Americans | 100.0 /100 | #29 | Exceptional 7.7% |
| Finns | 100.0 /100 | #30 | Exceptional 7.7% |
| Native Hawaiians | 100.0 /100 | #31 | Exceptional 7.7% |
| Malaysians | 100.0 /100 | #32 | Exceptional 7.7% |
| Immigrants | Taiwan | 100.0 /100 | #33 | Exceptional 7.7% |
| Immigrants | Vietnam | 100.0 /100 | #34 | Exceptional 7.7% |
| Cherokee | 99.9 /100 | #35 | Exceptional 7.7% |
| Iraqis | 99.9 /100 | #36 | Exceptional 7.7% |
Demographics Similar to Immigrants from Nicaragua by No Vehicles in Household
In terms of no vehicles in household, the demographic groups most similar to Immigrants from Nicaragua are Hungarian (9.9%, a difference of 0.060%), Immigrants from Bosnia and Herzegovina (9.9%, a difference of 0.15%), Bahamian (9.9%, a difference of 0.28%), Chilean (9.9%, a difference of 0.31%), and Immigrants from Bahamas (9.9%, a difference of 0.31%).
| Demographics | Rating | Rank | No Vehicles in Household |
| Immigrants | Lithuania | 84.0 /100 | #140 | Excellent 9.8% |
| Sudanese | 83.1 /100 | #141 | Excellent 9.8% |
| Immigrants | Zimbabwe | 82.6 /100 | #142 | Excellent 9.9% |
| Chileans | 81.2 /100 | #143 | Excellent 9.9% |
| Immigrants | Bahamas | 81.2 /100 | #144 | Excellent 9.9% |
| Bahamians | 81.0 /100 | #145 | Excellent 9.9% |
| Hungarians | 80.0 /100 | #146 | Excellent 9.9% |
| Immigrants | Nicaragua | 79.8 /100 | #147 | Good 9.9% |
| Immigrants | Bosnia and Herzegovina | 79.1 /100 | #148 | Good 9.9% |
| Immigrants | Uganda | 76.1 /100 | #149 | Good 10.0% |
| Colombians | 73.9 /100 | #150 | Good 10.0% |
| Immigrants | Eastern Africa | 73.8 /100 | #151 | Good 10.0% |
| Immigrants | Congo | 73.0 /100 | #152 | Good 10.1% |
| Tlingit-Haida | 72.5 /100 | #153 | Good 10.1% |
| Sioux | 72.4 /100 | #154 | Good 10.1% |