Immigrants from Kenya vs Immigrants from Africa 2nd Grade
COMPARE
Immigrants from Kenya
Immigrants from Africa
2nd Grade
2nd Grade Comparison
Immigrants from Kenya
Immigrants from Africa
97.8%
2ND GRADE
26.4/ 100
METRIC RATING
196th/ 347
METRIC RANK
97.5%
2ND GRADE
0.8/ 100
METRIC RATING
251st/ 347
METRIC RANK
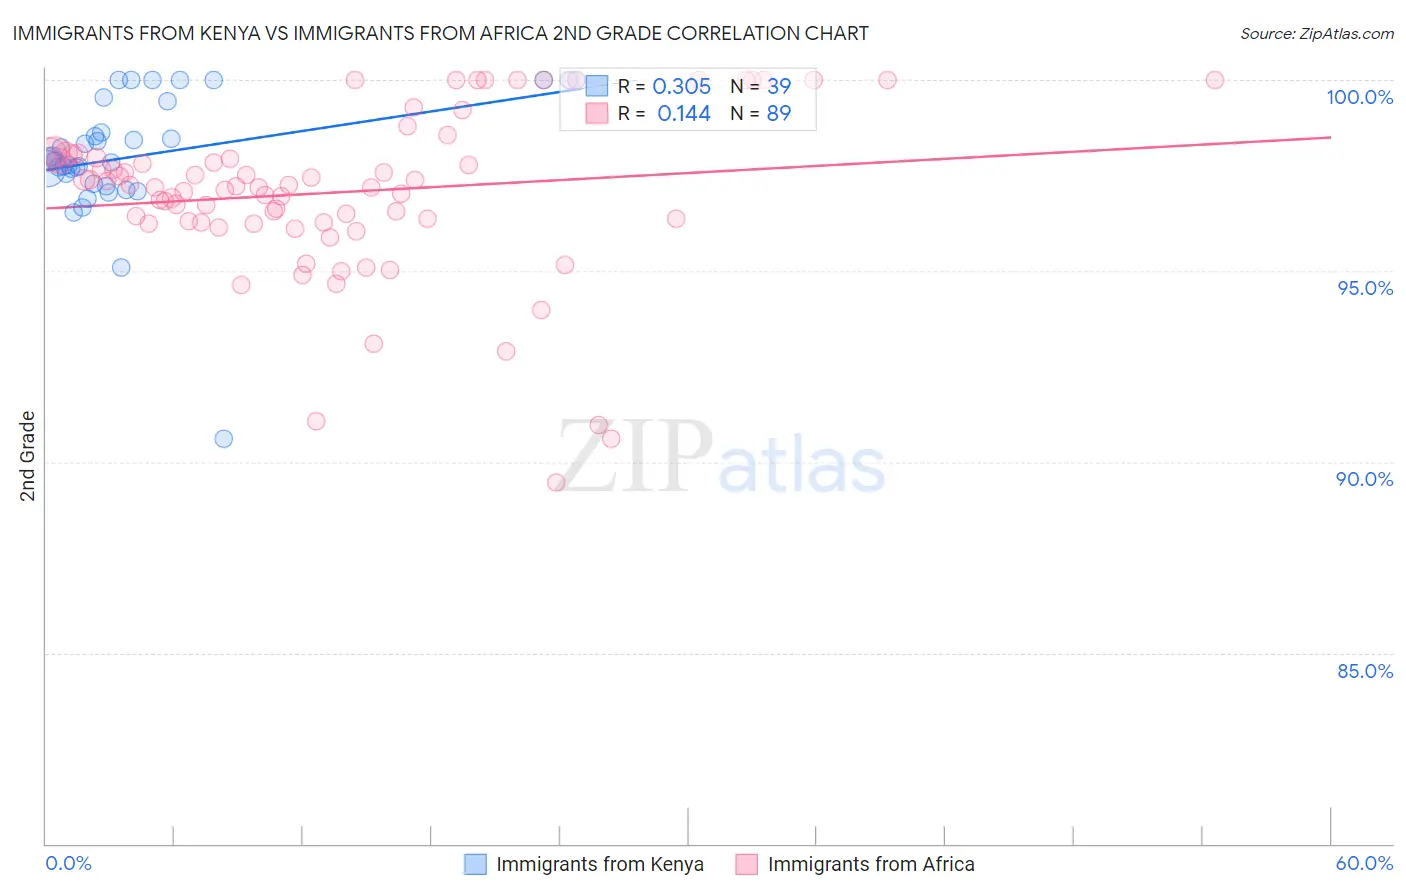
Immigrants from Kenya vs Immigrants from Africa 2nd Grade Correlation Chart
The statistical analysis conducted on geographies consisting of 218,076,690 people shows a mild positive correlation between the proportion of Immigrants from Kenya and percentage of population with at least 2nd grade education in the United States with a correlation coefficient (R) of 0.305 and weighted average of 97.8%. Similarly, the statistical analysis conducted on geographies consisting of 469,440,174 people shows a poor positive correlation between the proportion of Immigrants from Africa and percentage of population with at least 2nd grade education in the United States with a correlation coefficient (R) of 0.144 and weighted average of 97.5%, a difference of 0.30%.
2nd Grade Correlation Summary
| Measurement | Immigrants from Kenya | Immigrants from Africa |
| Minimum | 90.6% | 89.5% |
| Maximum | 100.0% | 100.0% |
| Range | 9.4% | 10.5% |
| Mean | 98.0% | 97.1% |
| Median | 97.9% | 97.2% |
| Interquartile 25% (IQ1) | 97.3% | 96.3% |
| Interquartile 75% (IQ3) | 99.5% | 98.0% |
| Interquartile Range (IQR) | 2.2% | 1.8% |
| Standard Deviation (Sample) | 1.7% | 2.2% |
| Standard Deviation (Population) | 1.7% | 2.2% |
Similar Demographics by 2nd Grade
Demographics Similar to Immigrants from Kenya by 2nd Grade
In terms of 2nd grade, the demographic groups most similar to Immigrants from Kenya are Paiute (97.8%, a difference of 0.0%), Mongolian (97.8%, a difference of 0.0%), Immigrants from Uganda (97.8%, a difference of 0.0%), Guamanian/Chamorro (97.8%, a difference of 0.0%), and Black/African American (97.8%, a difference of 0.010%).
| Demographics | Rating | Rank | 2nd Grade |
| Panamanians | 33.5 /100 | #189 | Fair 97.8% |
| Immigrants | Taiwan | 31.8 /100 | #190 | Fair 97.8% |
| Paraguayans | 30.8 /100 | #191 | Fair 97.8% |
| Blacks/African Americans | 29.9 /100 | #192 | Fair 97.8% |
| Hawaiians | 28.5 /100 | #193 | Fair 97.8% |
| Paiute | 27.0 /100 | #194 | Fair 97.8% |
| Mongolians | 26.7 /100 | #195 | Fair 97.8% |
| Immigrants | Kenya | 26.4 /100 | #196 | Fair 97.8% |
| Immigrants | Uganda | 26.3 /100 | #197 | Fair 97.8% |
| Guamanians/Chamorros | 25.7 /100 | #198 | Fair 97.8% |
| Immigrants | Egypt | 24.4 /100 | #199 | Fair 97.8% |
| Immigrants | Lebanon | 20.9 /100 | #200 | Fair 97.8% |
| Tohono O'odham | 20.9 /100 | #201 | Fair 97.8% |
| Immigrants | Ukraine | 20.5 /100 | #202 | Fair 97.8% |
| Yuman | 20.0 /100 | #203 | Fair 97.8% |
Demographics Similar to Immigrants from Africa by 2nd Grade
In terms of 2nd grade, the demographic groups most similar to Immigrants from Africa are Immigrants from Eastern Africa (97.5%, a difference of 0.010%), South American (97.5%, a difference of 0.010%), Immigrants from Senegal (97.5%, a difference of 0.010%), Immigrants from Middle Africa (97.5%, a difference of 0.010%), and Bolivian (97.5%, a difference of 0.010%).
| Demographics | Rating | Rank | 2nd Grade |
| Immigrants | Iraq | 1.0 /100 | #244 | Tragic 97.5% |
| Immigrants | Eastern Africa | 0.9 /100 | #245 | Tragic 97.5% |
| South Americans | 0.9 /100 | #246 | Tragic 97.5% |
| Immigrants | Senegal | 0.9 /100 | #247 | Tragic 97.5% |
| Immigrants | Middle Africa | 0.9 /100 | #248 | Tragic 97.5% |
| Bolivians | 0.9 /100 | #249 | Tragic 97.5% |
| Peruvians | 0.9 /100 | #250 | Tragic 97.5% |
| Immigrants | Africa | 0.8 /100 | #251 | Tragic 97.5% |
| Immigrants | Asia | 0.7 /100 | #252 | Tragic 97.5% |
| Puerto Ricans | 0.7 /100 | #253 | Tragic 97.5% |
| Indians (Asian) | 0.6 /100 | #254 | Tragic 97.5% |
| Immigrants | Congo | 0.6 /100 | #255 | Tragic 97.5% |
| Jamaicans | 0.6 /100 | #256 | Tragic 97.5% |
| Immigrants | Colombia | 0.5 /100 | #257 | Tragic 97.5% |
| Yaqui | 0.5 /100 | #258 | Tragic 97.5% |