Immigrants from Japan vs Asian No Vehicles in Household
COMPARE
Immigrants from Japan
Asian
No Vehicles in Household
No Vehicles in Household Comparison
Immigrants from Japan
Asians
11.4%
NO VEHICLES IN HOUSEHOLD
5.1/ 100
METRIC RATING
231st/ 347
METRIC RANK
9.0%
NO VEHICLES IN HOUSEHOLD
98.3/ 100
METRIC RATING
100th/ 347
METRIC RANK
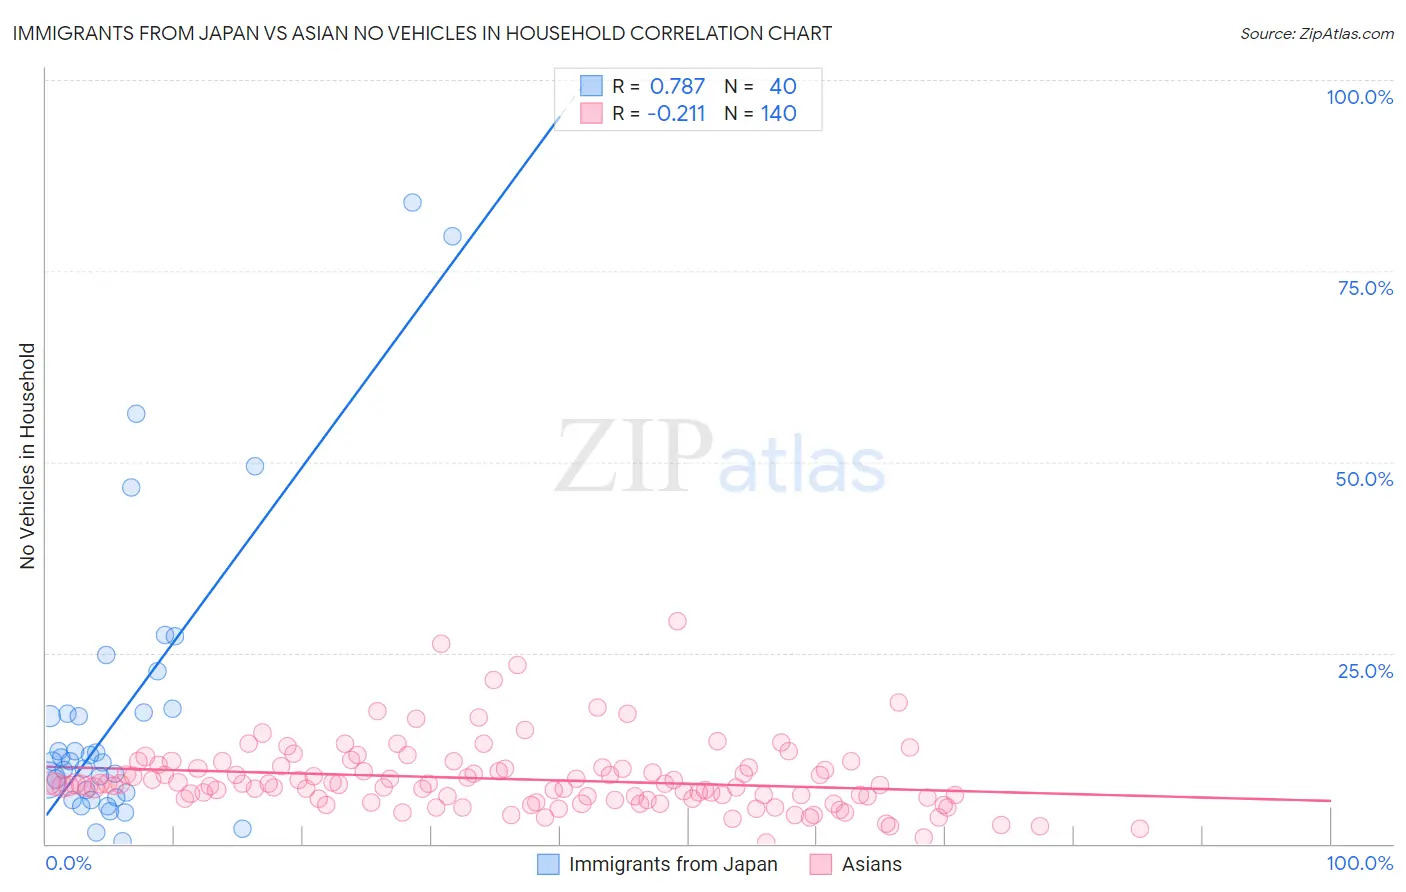
Immigrants from Japan vs Asian No Vehicles in Household Correlation Chart
The statistical analysis conducted on geographies consisting of 339,466,536 people shows a strong positive correlation between the proportion of Immigrants from Japan and percentage of households with no vehicle available in the United States with a correlation coefficient (R) of 0.787 and weighted average of 11.4%. Similarly, the statistical analysis conducted on geographies consisting of 534,555,995 people shows a weak negative correlation between the proportion of Asians and percentage of households with no vehicle available in the United States with a correlation coefficient (R) of -0.211 and weighted average of 9.0%, a difference of 27.5%.
No Vehicles in Household Correlation Summary
| Measurement | Immigrants from Japan | Asian |
| Minimum | 0.40% | 0.21% |
| Maximum | 83.9% | 29.2% |
| Range | 83.5% | 29.0% |
| Mean | 17.5% | 8.5% |
| Median | 10.8% | 7.7% |
| Interquartile 25% (IQ1) | 6.4% | 5.9% |
| Interquartile 75% (IQ3) | 17.4% | 9.9% |
| Interquartile Range (IQR) | 11.0% | 4.0% |
| Standard Deviation (Sample) | 19.4% | 4.5% |
| Standard Deviation (Population) | 19.2% | 4.5% |
Similar Demographics by No Vehicles in Household
Demographics Similar to Immigrants from Japan by No Vehicles in Household
In terms of no vehicles in household, the demographic groups most similar to Immigrants from Japan are Immigrants from Norway (11.4%, a difference of 0.0%), Ugandan (11.4%, a difference of 0.13%), Immigrants from Romania (11.4%, a difference of 0.17%), Immigrants from Turkey (11.5%, a difference of 0.19%), and Immigrants from Pakistan (11.4%, a difference of 0.21%).
| Demographics | Rating | Rank | No Vehicles in Household |
| Immigrants | Hong Kong | 7.2 /100 | #224 | Tragic 11.3% |
| Immigrants | Sierra Leone | 6.4 /100 | #225 | Tragic 11.3% |
| Immigrants | Somalia | 5.4 /100 | #226 | Tragic 11.4% |
| Immigrants | Pakistan | 5.4 /100 | #227 | Tragic 11.4% |
| Immigrants | Romania | 5.3 /100 | #228 | Tragic 11.4% |
| Ugandans | 5.3 /100 | #229 | Tragic 11.4% |
| Immigrants | Norway | 5.1 /100 | #230 | Tragic 11.4% |
| Immigrants | Japan | 5.1 /100 | #231 | Tragic 11.4% |
| Immigrants | Turkey | 4.8 /100 | #232 | Tragic 11.5% |
| Houma | 4.7 /100 | #233 | Tragic 11.5% |
| Immigrants | Peru | 4.5 /100 | #234 | Tragic 11.5% |
| Kiowa | 4.0 /100 | #235 | Tragic 11.5% |
| Cree | 3.5 /100 | #236 | Tragic 11.6% |
| Ute | 3.3 /100 | #237 | Tragic 11.6% |
| Russians | 3.2 /100 | #238 | Tragic 11.6% |
Demographics Similar to Asians by No Vehicles in Household
In terms of no vehicles in household, the demographic groups most similar to Asians are Pakistani (9.0%, a difference of 0.040%), Yugoslavian (9.0%, a difference of 0.080%), Seminole (9.0%, a difference of 0.080%), Bulgarian (9.0%, a difference of 0.18%), and Slavic (9.0%, a difference of 0.24%).
| Demographics | Rating | Rank | No Vehicles in Household |
| Immigrants | North America | 99.1 /100 | #93 | Exceptional 8.7% |
| Austrians | 98.9 /100 | #94 | Exceptional 8.8% |
| Potawatomi | 98.8 /100 | #95 | Exceptional 8.8% |
| Immigrants | Bolivia | 98.7 /100 | #96 | Exceptional 8.9% |
| Immigrants | Central America | 98.5 /100 | #97 | Exceptional 8.9% |
| Slavs | 98.4 /100 | #98 | Exceptional 9.0% |
| Bulgarians | 98.4 /100 | #99 | Exceptional 9.0% |
| Asians | 98.3 /100 | #100 | Exceptional 9.0% |
| Pakistanis | 98.3 /100 | #101 | Exceptional 9.0% |
| Yugoslavians | 98.3 /100 | #102 | Exceptional 9.0% |
| Seminole | 98.3 /100 | #103 | Exceptional 9.0% |
| Zimbabweans | 98.0 /100 | #104 | Exceptional 9.0% |
| Spanish Americans | 97.9 /100 | #105 | Exceptional 9.1% |
| Laotians | 97.8 /100 | #106 | Exceptional 9.1% |
| Hispanics or Latinos | 97.7 /100 | #107 | Exceptional 9.1% |