Immigrants from Japan vs Asian Median Male Earnings
COMPARE
Immigrants from Japan
Asian
Median Male Earnings
Median Male Earnings Comparison
Immigrants from Japan
Asians
$65,518
MEDIAN MALE EARNINGS
100.0/ 100
METRIC RATING
20th/ 347
METRIC RANK
$63,827
MEDIAN MALE EARNINGS
100.0/ 100
METRIC RATING
29th/ 347
METRIC RANK
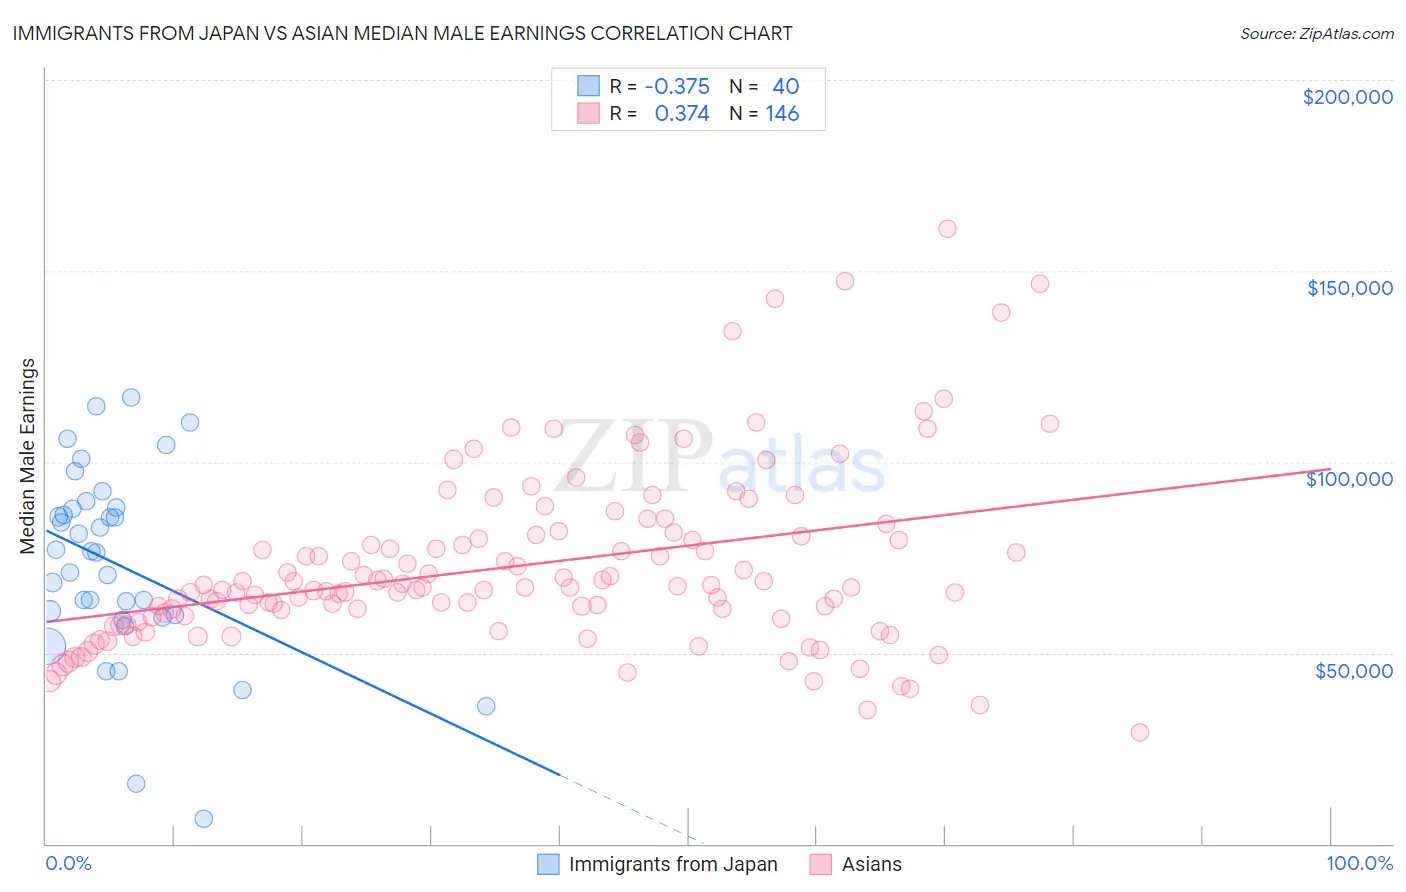
Immigrants from Japan vs Asian Median Male Earnings Correlation Chart
The statistical analysis conducted on geographies consisting of 340,085,326 people shows a mild negative correlation between the proportion of Immigrants from Japan and median male earnings in the United States with a correlation coefficient (R) of -0.375 and weighted average of $65,518. Similarly, the statistical analysis conducted on geographies consisting of 550,236,506 people shows a mild positive correlation between the proportion of Asians and median male earnings in the United States with a correlation coefficient (R) of 0.374 and weighted average of $63,827, a difference of 2.6%.
Median Male Earnings Correlation Summary
| Measurement | Immigrants from Japan | Asian |
| Minimum | $6,550 | $29,236 |
| Maximum | $116,935 | $160,917 |
| Range | $110,385 | $131,681 |
| Mean | $73,268 | $72,799 |
| Median | $76,382 | $67,194 |
| Interquartile 25% (IQ1) | $59,676 | $59,553 |
| Interquartile 75% (IQ3) | $87,930 | $80,527 |
| Interquartile Range (IQR) | $28,253 | $20,975 |
| Standard Deviation (Sample) | $24,811 | $23,189 |
| Standard Deviation (Population) | $24,499 | $23,109 |
Demographics Similar to Immigrants from Japan and Asians by Median Male Earnings
In terms of median male earnings, the demographic groups most similar to Immigrants from Japan are Cypriot ($65,549, a difference of 0.050%), Immigrants from Sweden ($65,406, a difference of 0.17%), Burmese ($65,236, a difference of 0.43%), Immigrants from Korea ($65,079, a difference of 0.67%), and Immigrants from Northern Europe ($64,987, a difference of 0.82%). Similarly, the demographic groups most similar to Asians are Russian ($63,939, a difference of 0.17%), Immigrants from Switzerland ($63,944, a difference of 0.18%), Immigrants from France ($63,715, a difference of 0.18%), Latvian ($63,498, a difference of 0.52%), and Turkish ($64,253, a difference of 0.67%).
| Demographics | Rating | Rank | Median Male Earnings |
| Okinawans | 100.0 /100 | #14 | Exceptional $67,232 |
| Immigrants | Eastern Asia | 100.0 /100 | #15 | Exceptional $66,903 |
| Eastern Europeans | 100.0 /100 | #16 | Exceptional $66,472 |
| Immigrants | Belgium | 100.0 /100 | #17 | Exceptional $66,125 |
| Indians (Asian) | 100.0 /100 | #18 | Exceptional $66,078 |
| Cypriots | 100.0 /100 | #19 | Exceptional $65,549 |
| Immigrants | Japan | 100.0 /100 | #20 | Exceptional $65,518 |
| Immigrants | Sweden | 100.0 /100 | #21 | Exceptional $65,406 |
| Burmese | 100.0 /100 | #22 | Exceptional $65,236 |
| Immigrants | Korea | 100.0 /100 | #23 | Exceptional $65,079 |
| Immigrants | Northern Europe | 100.0 /100 | #24 | Exceptional $64,987 |
| Immigrants | Denmark | 100.0 /100 | #25 | Exceptional $64,625 |
| Turks | 100.0 /100 | #26 | Exceptional $64,253 |
| Immigrants | Switzerland | 100.0 /100 | #27 | Exceptional $63,944 |
| Russians | 100.0 /100 | #28 | Exceptional $63,939 |
| Asians | 100.0 /100 | #29 | Exceptional $63,827 |
| Immigrants | France | 100.0 /100 | #30 | Exceptional $63,715 |
| Latvians | 100.0 /100 | #31 | Exceptional $63,498 |
| Soviet Union | 100.0 /100 | #32 | Exceptional $63,382 |
| Immigrants | Lithuania | 100.0 /100 | #33 | Exceptional $63,346 |
| Immigrants | Russia | 100.0 /100 | #34 | Exceptional $63,326 |