Immigrants from Japan vs Immigrants from Ethiopia No Vehicles in Household
COMPARE
Immigrants from Japan
Immigrants from Ethiopia
No Vehicles in Household
No Vehicles in Household Comparison
Immigrants from Japan
Immigrants from Ethiopia
11.4%
NO VEHICLES IN HOUSEHOLD
5.1/ 100
METRIC RATING
231st/ 347
METRIC RANK
10.4%
NO VEHICLES IN HOUSEHOLD
48.0/ 100
METRIC RATING
178th/ 347
METRIC RANK
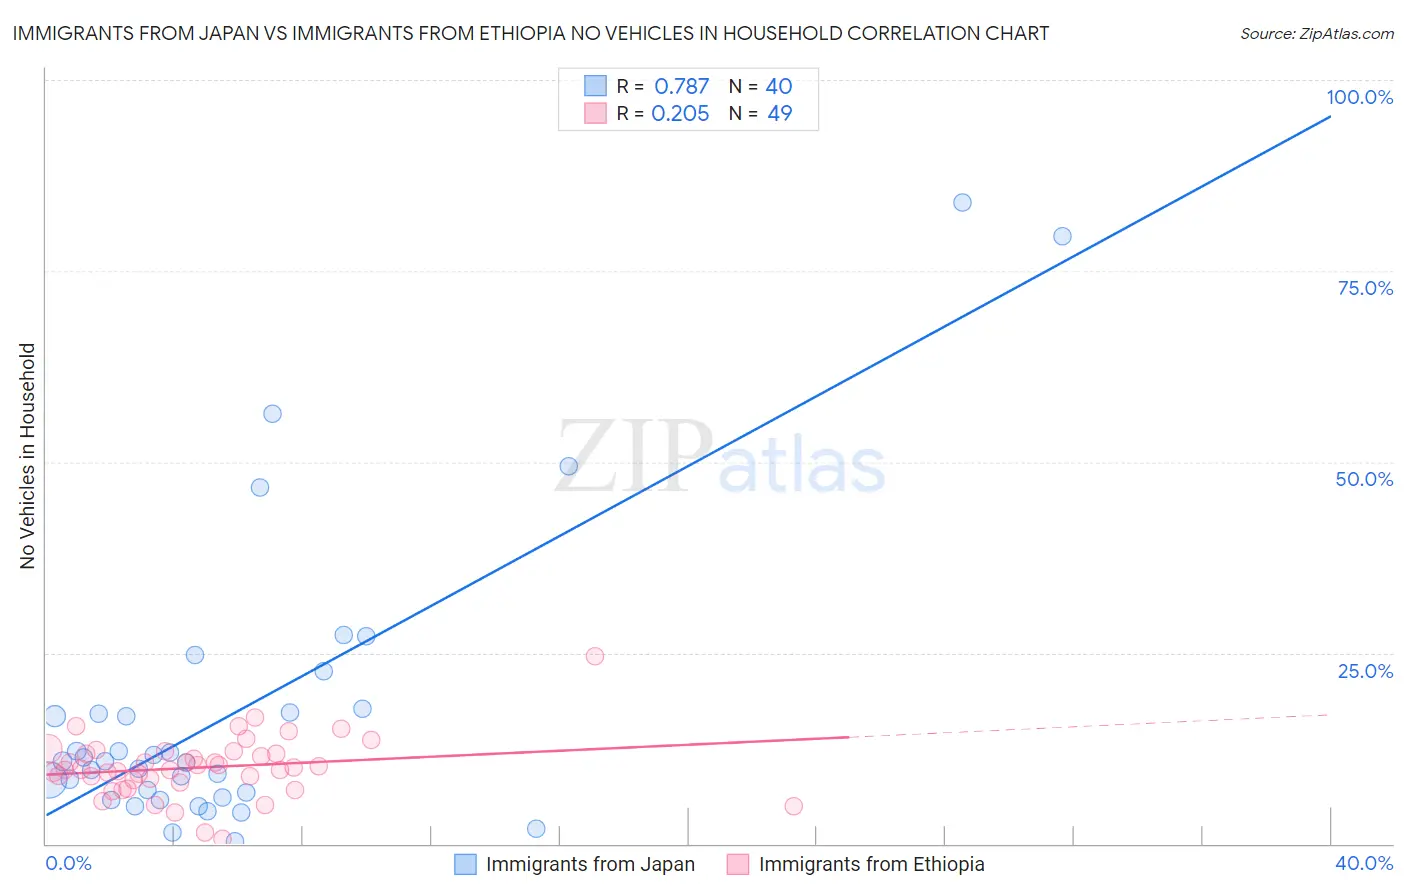
Immigrants from Japan vs Immigrants from Ethiopia No Vehicles in Household Correlation Chart
The statistical analysis conducted on geographies consisting of 339,466,536 people shows a strong positive correlation between the proportion of Immigrants from Japan and percentage of households with no vehicle available in the United States with a correlation coefficient (R) of 0.787 and weighted average of 11.4%. Similarly, the statistical analysis conducted on geographies consisting of 211,218,497 people shows a weak positive correlation between the proportion of Immigrants from Ethiopia and percentage of households with no vehicle available in the United States with a correlation coefficient (R) of 0.205 and weighted average of 10.4%, a difference of 9.6%.
No Vehicles in Household Correlation Summary
| Measurement | Immigrants from Japan | Immigrants from Ethiopia |
| Minimum | 0.40% | 0.65% |
| Maximum | 83.9% | 24.5% |
| Range | 83.5% | 23.8% |
| Mean | 17.5% | 10.0% |
| Median | 10.8% | 9.8% |
| Interquartile 25% (IQ1) | 6.4% | 8.2% |
| Interquartile 75% (IQ3) | 17.4% | 11.9% |
| Interquartile Range (IQR) | 11.0% | 3.8% |
| Standard Deviation (Sample) | 19.4% | 4.0% |
| Standard Deviation (Population) | 19.2% | 3.9% |
Similar Demographics by No Vehicles in Household
Demographics Similar to Immigrants from Japan by No Vehicles in Household
In terms of no vehicles in household, the demographic groups most similar to Immigrants from Japan are Immigrants from Norway (11.4%, a difference of 0.0%), Ugandan (11.4%, a difference of 0.13%), Immigrants from Romania (11.4%, a difference of 0.17%), Immigrants from Turkey (11.5%, a difference of 0.19%), and Immigrants from Pakistan (11.4%, a difference of 0.21%).
| Demographics | Rating | Rank | No Vehicles in Household |
| Immigrants | Hong Kong | 7.2 /100 | #224 | Tragic 11.3% |
| Immigrants | Sierra Leone | 6.4 /100 | #225 | Tragic 11.3% |
| Immigrants | Somalia | 5.4 /100 | #226 | Tragic 11.4% |
| Immigrants | Pakistan | 5.4 /100 | #227 | Tragic 11.4% |
| Immigrants | Romania | 5.3 /100 | #228 | Tragic 11.4% |
| Ugandans | 5.3 /100 | #229 | Tragic 11.4% |
| Immigrants | Norway | 5.1 /100 | #230 | Tragic 11.4% |
| Immigrants | Japan | 5.1 /100 | #231 | Tragic 11.4% |
| Immigrants | Turkey | 4.8 /100 | #232 | Tragic 11.5% |
| Houma | 4.7 /100 | #233 | Tragic 11.5% |
| Immigrants | Peru | 4.5 /100 | #234 | Tragic 11.5% |
| Kiowa | 4.0 /100 | #235 | Tragic 11.5% |
| Cree | 3.5 /100 | #236 | Tragic 11.6% |
| Ute | 3.3 /100 | #237 | Tragic 11.6% |
| Russians | 3.2 /100 | #238 | Tragic 11.6% |
Demographics Similar to Immigrants from Ethiopia by No Vehicles in Household
In terms of no vehicles in household, the demographic groups most similar to Immigrants from Ethiopia are Immigrants from El Salvador (10.4%, a difference of 0.15%), Immigrants from Burma/Myanmar (10.4%, a difference of 0.16%), French American Indian (10.4%, a difference of 0.16%), Immigrants from Sudan (10.4%, a difference of 0.27%), and Filipino (10.4%, a difference of 0.28%).
| Demographics | Rating | Rank | No Vehicles in Household |
| Hmong | 52.7 /100 | #171 | Average 10.4% |
| Brazilians | 51.7 /100 | #172 | Average 10.4% |
| Filipinos | 50.1 /100 | #173 | Average 10.4% |
| Immigrants | Sudan | 50.0 /100 | #174 | Average 10.4% |
| Immigrants | Burma/Myanmar | 49.1 /100 | #175 | Average 10.4% |
| French American Indians | 49.1 /100 | #176 | Average 10.4% |
| Immigrants | El Salvador | 49.1 /100 | #177 | Average 10.4% |
| Immigrants | Ethiopia | 48.0 /100 | #178 | Average 10.4% |
| Ethiopians | 45.8 /100 | #179 | Average 10.5% |
| Arabs | 45.3 /100 | #180 | Average 10.5% |
| Immigrants | Colombia | 44.1 /100 | #181 | Average 10.5% |
| Immigrants | Bulgaria | 43.8 /100 | #182 | Average 10.5% |
| Natives/Alaskans | 43.7 /100 | #183 | Average 10.5% |
| Immigrants | Nepal | 42.4 /100 | #184 | Average 10.5% |
| South Americans | 41.9 /100 | #185 | Average 10.5% |