Immigrants from Ethiopia vs Swiss 4 or more Vehicles in Household
COMPARE
Immigrants from Ethiopia
Swiss
4 or more Vehicles in Household
4 or more Vehicles in Household Comparison
Immigrants from Ethiopia
Swiss
5.7%
4 OR MORE VEHICLES IN HOUSEHOLD
2.4/ 100
METRIC RATING
247th/ 347
METRIC RANK
7.8%
4 OR MORE VEHICLES IN HOUSEHOLD
100.0/ 100
METRIC RATING
48th/ 347
METRIC RANK
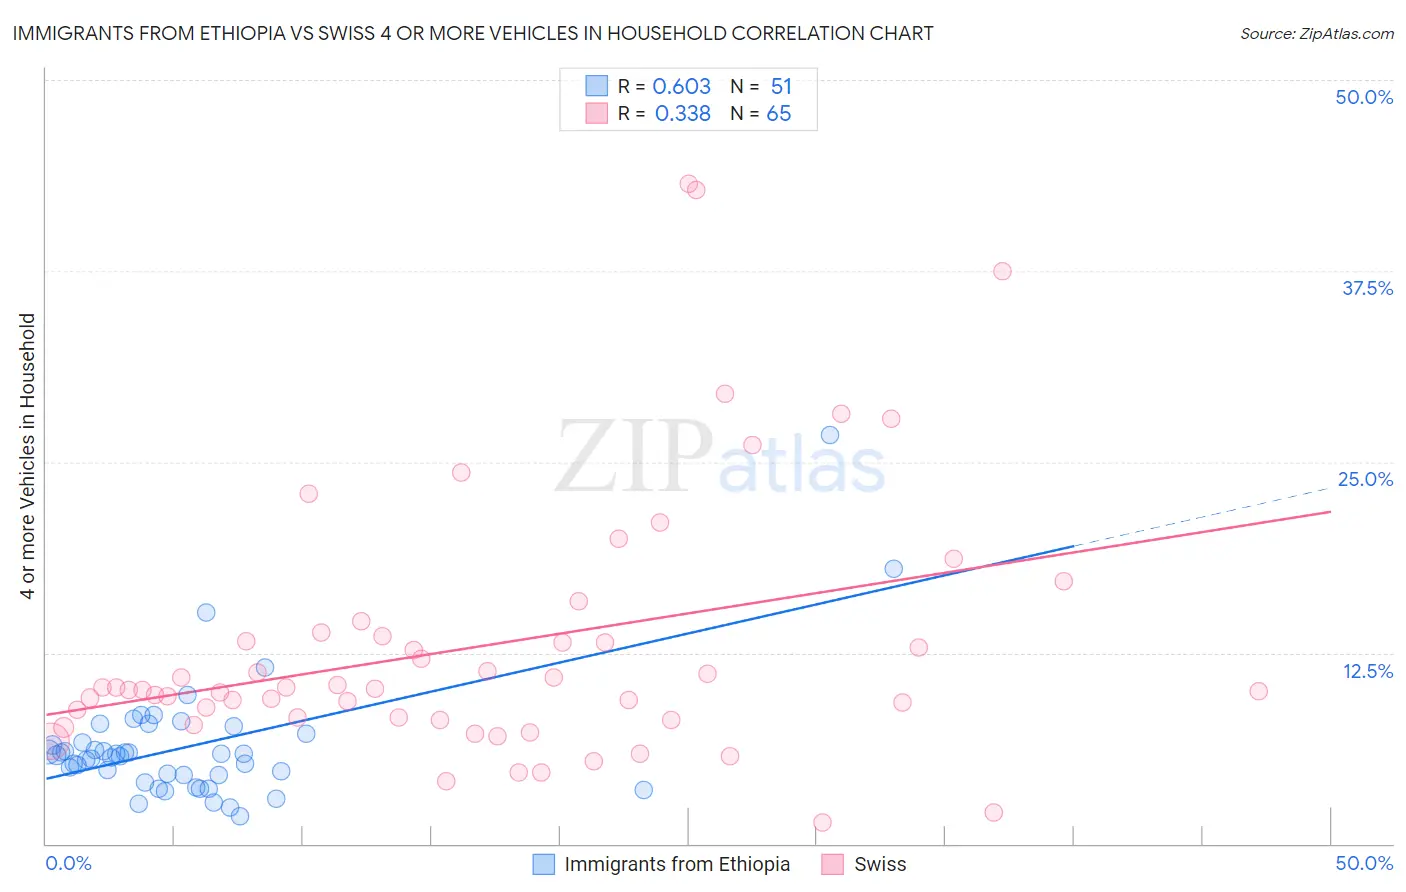
Immigrants from Ethiopia vs Swiss 4 or more Vehicles in Household Correlation Chart
The statistical analysis conducted on geographies consisting of 210,800,078 people shows a significant positive correlation between the proportion of Immigrants from Ethiopia and percentage of households with 4 or more vehicles available in the United States with a correlation coefficient (R) of 0.603 and weighted average of 5.7%. Similarly, the statistical analysis conducted on geographies consisting of 463,313,966 people shows a mild positive correlation between the proportion of Swiss and percentage of households with 4 or more vehicles available in the United States with a correlation coefficient (R) of 0.338 and weighted average of 7.8%, a difference of 35.2%.
4 or more Vehicles in Household Correlation Summary
| Measurement | Immigrants from Ethiopia | Swiss |
| Minimum | 1.8% | 1.4% |
| Maximum | 26.8% | 43.2% |
| Range | 24.9% | 41.8% |
| Mean | 6.4% | 13.0% |
| Median | 5.8% | 10.1% |
| Interquartile 25% (IQ1) | 4.5% | 8.2% |
| Interquartile 75% (IQ3) | 7.2% | 13.7% |
| Interquartile Range (IQR) | 2.7% | 5.5% |
| Standard Deviation (Sample) | 4.1% | 8.7% |
| Standard Deviation (Population) | 4.1% | 8.6% |
Similar Demographics by 4 or more Vehicles in Household
Demographics Similar to Immigrants from Ethiopia by 4 or more Vehicles in Household
In terms of 4 or more vehicles in household, the demographic groups most similar to Immigrants from Ethiopia are Immigrants from North Macedonia (5.7%, a difference of 0.030%), Immigrants from Eastern Africa (5.7%, a difference of 0.11%), Immigrants from Southern Europe (5.7%, a difference of 0.13%), Immigrants from Europe (5.7%, a difference of 0.23%), and Ugandan (5.7%, a difference of 0.25%).
| Demographics | Rating | Rank | 4 or more Vehicles in Household |
| Immigrants | Poland | 3.8 /100 | #240 | Tragic 5.8% |
| Mongolians | 3.7 /100 | #241 | Tragic 5.8% |
| Immigrants | Middle Africa | 3.4 /100 | #242 | Tragic 5.8% |
| Immigrants | Czechoslovakia | 3.2 /100 | #243 | Tragic 5.8% |
| Ethiopians | 3.2 /100 | #244 | Tragic 5.8% |
| Bulgarians | 3.1 /100 | #245 | Tragic 5.8% |
| Immigrants | North Macedonia | 2.5 /100 | #246 | Tragic 5.7% |
| Immigrants | Ethiopia | 2.4 /100 | #247 | Tragic 5.7% |
| Immigrants | Eastern Africa | 2.4 /100 | #248 | Tragic 5.7% |
| Immigrants | Southern Europe | 2.3 /100 | #249 | Tragic 5.7% |
| Immigrants | Europe | 2.3 /100 | #250 | Tragic 5.7% |
| Ugandans | 2.2 /100 | #251 | Tragic 5.7% |
| Sub-Saharan Africans | 2.1 /100 | #252 | Tragic 5.7% |
| Immigrants | Cuba | 1.6 /100 | #253 | Tragic 5.7% |
| Immigrants | Panama | 1.5 /100 | #254 | Tragic 5.7% |
Demographics Similar to Swiss by 4 or more Vehicles in Household
In terms of 4 or more vehicles in household, the demographic groups most similar to Swiss are Osage (7.8%, a difference of 0.17%), Cherokee (7.7%, a difference of 0.19%), Crow (7.8%, a difference of 0.34%), Immigrants from El Salvador (7.7%, a difference of 0.35%), and Choctaw (7.8%, a difference of 0.51%).
| Demographics | Rating | Rank | 4 or more Vehicles in Household |
| Pima | 100.0 /100 | #41 | Exceptional 7.9% |
| Salvadorans | 100.0 /100 | #42 | Exceptional 7.8% |
| Fijians | 100.0 /100 | #43 | Exceptional 7.8% |
| Bhutanese | 100.0 /100 | #44 | Exceptional 7.8% |
| Choctaw | 100.0 /100 | #45 | Exceptional 7.8% |
| Crow | 100.0 /100 | #46 | Exceptional 7.8% |
| Osage | 100.0 /100 | #47 | Exceptional 7.8% |
| Swiss | 100.0 /100 | #48 | Exceptional 7.8% |
| Cherokee | 100.0 /100 | #49 | Exceptional 7.7% |
| Immigrants | El Salvador | 100.0 /100 | #50 | Exceptional 7.7% |
| Immigrants | Laos | 100.0 /100 | #51 | Exceptional 7.7% |
| Japanese | 100.0 /100 | #52 | Exceptional 7.7% |
| Malaysians | 100.0 /100 | #53 | Exceptional 7.7% |
| Dutch | 100.0 /100 | #54 | Exceptional 7.7% |
| Immigrants | Oceania | 100.0 /100 | #55 | Exceptional 7.6% |