Immigrants from Ethiopia vs Immigrants from Serbia 4 or more Vehicles in Household
COMPARE
Immigrants from Ethiopia
Immigrants from Serbia
4 or more Vehicles in Household
4 or more Vehicles in Household Comparison
Immigrants from Ethiopia
Immigrants from Serbia
5.7%
4 OR MORE VEHICLES IN HOUSEHOLD
2.4/ 100
METRIC RATING
247th/ 347
METRIC RANK
5.0%
4 OR MORE VEHICLES IN HOUSEHOLD
0.0/ 100
METRIC RATING
306th/ 347
METRIC RANK
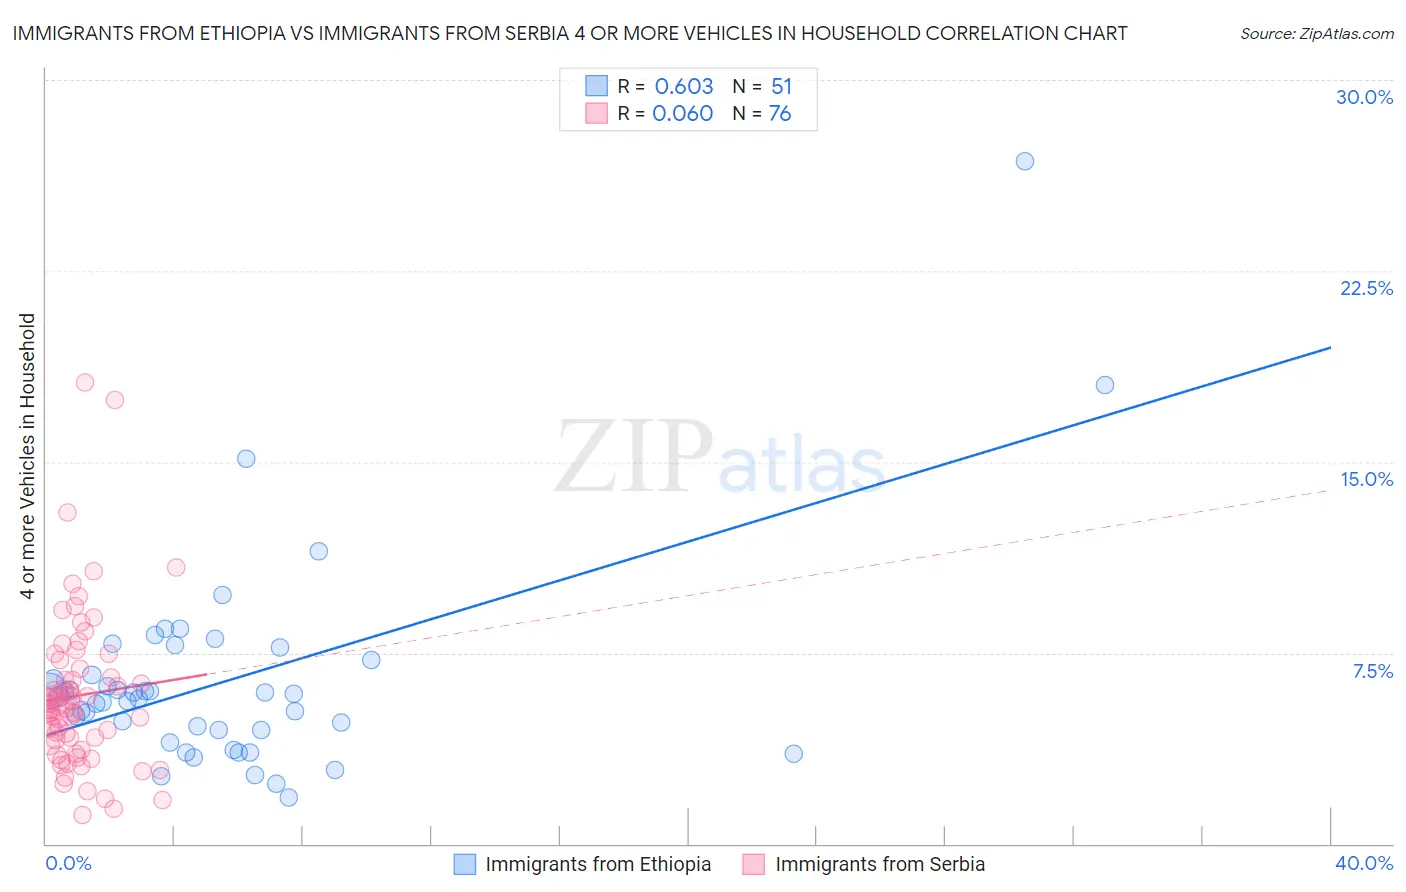
Immigrants from Ethiopia vs Immigrants from Serbia 4 or more Vehicles in Household Correlation Chart
The statistical analysis conducted on geographies consisting of 210,800,078 people shows a significant positive correlation between the proportion of Immigrants from Ethiopia and percentage of households with 4 or more vehicles available in the United States with a correlation coefficient (R) of 0.603 and weighted average of 5.7%. Similarly, the statistical analysis conducted on geographies consisting of 131,136,431 people shows a slight positive correlation between the proportion of Immigrants from Serbia and percentage of households with 4 or more vehicles available in the United States with a correlation coefficient (R) of 0.060 and weighted average of 5.0%, a difference of 14.2%.
4 or more Vehicles in Household Correlation Summary
| Measurement | Immigrants from Ethiopia | Immigrants from Serbia |
| Minimum | 1.8% | 1.1% |
| Maximum | 26.8% | 18.1% |
| Range | 24.9% | 17.0% |
| Mean | 6.4% | 5.8% |
| Median | 5.8% | 5.4% |
| Interquartile 25% (IQ1) | 4.5% | 4.0% |
| Interquartile 75% (IQ3) | 7.2% | 6.7% |
| Interquartile Range (IQR) | 2.7% | 2.7% |
| Standard Deviation (Sample) | 4.1% | 3.1% |
| Standard Deviation (Population) | 4.1% | 3.0% |
Similar Demographics by 4 or more Vehicles in Household
Demographics Similar to Immigrants from Ethiopia by 4 or more Vehicles in Household
In terms of 4 or more vehicles in household, the demographic groups most similar to Immigrants from Ethiopia are Immigrants from North Macedonia (5.7%, a difference of 0.030%), Immigrants from Eastern Africa (5.7%, a difference of 0.11%), Immigrants from Southern Europe (5.7%, a difference of 0.13%), Immigrants from Europe (5.7%, a difference of 0.23%), and Ugandan (5.7%, a difference of 0.25%).
| Demographics | Rating | Rank | 4 or more Vehicles in Household |
| Immigrants | Poland | 3.8 /100 | #240 | Tragic 5.8% |
| Mongolians | 3.7 /100 | #241 | Tragic 5.8% |
| Immigrants | Middle Africa | 3.4 /100 | #242 | Tragic 5.8% |
| Immigrants | Czechoslovakia | 3.2 /100 | #243 | Tragic 5.8% |
| Ethiopians | 3.2 /100 | #244 | Tragic 5.8% |
| Bulgarians | 3.1 /100 | #245 | Tragic 5.8% |
| Immigrants | North Macedonia | 2.5 /100 | #246 | Tragic 5.7% |
| Immigrants | Ethiopia | 2.4 /100 | #247 | Tragic 5.7% |
| Immigrants | Eastern Africa | 2.4 /100 | #248 | Tragic 5.7% |
| Immigrants | Southern Europe | 2.3 /100 | #249 | Tragic 5.7% |
| Immigrants | Europe | 2.3 /100 | #250 | Tragic 5.7% |
| Ugandans | 2.2 /100 | #251 | Tragic 5.7% |
| Sub-Saharan Africans | 2.1 /100 | #252 | Tragic 5.7% |
| Immigrants | Cuba | 1.6 /100 | #253 | Tragic 5.7% |
| Immigrants | Panama | 1.5 /100 | #254 | Tragic 5.7% |
Demographics Similar to Immigrants from Serbia by 4 or more Vehicles in Household
In terms of 4 or more vehicles in household, the demographic groups most similar to Immigrants from Serbia are Cypriot (5.0%, a difference of 0.090%), Somali (5.0%, a difference of 0.090%), Immigrants from Greece (5.1%, a difference of 0.64%), Menominee (5.0%, a difference of 0.94%), and Bahamian (5.1%, a difference of 1.1%).
| Demographics | Rating | Rank | 4 or more Vehicles in Household |
| Immigrants | Ghana | 0.1 /100 | #299 | Tragic 5.2% |
| Immigrants | Morocco | 0.0 /100 | #300 | Tragic 5.1% |
| Immigrants | Zaire | 0.0 /100 | #301 | Tragic 5.1% |
| Bahamians | 0.0 /100 | #302 | Tragic 5.1% |
| Immigrants | Greece | 0.0 /100 | #303 | Tragic 5.1% |
| Cypriots | 0.0 /100 | #304 | Tragic 5.0% |
| Somalis | 0.0 /100 | #305 | Tragic 5.0% |
| Immigrants | Serbia | 0.0 /100 | #306 | Tragic 5.0% |
| Menominee | 0.0 /100 | #307 | Tragic 5.0% |
| Paraguayans | 0.0 /100 | #308 | Tragic 4.9% |
| Immigrants | Somalia | 0.0 /100 | #309 | Tragic 4.9% |
| Moroccans | 0.0 /100 | #310 | Tragic 4.9% |
| Houma | 0.0 /100 | #311 | Tragic 4.9% |
| Albanians | 0.0 /100 | #312 | Tragic 4.8% |
| Immigrants | Israel | 0.0 /100 | #313 | Tragic 4.8% |