Immigrants from England vs Colombian No Vehicles in Household
COMPARE
Immigrants from England
Colombian
No Vehicles in Household
No Vehicles in Household Comparison
Immigrants from England
Colombians
8.7%
NO VEHICLES IN HOUSEHOLD
99.2/ 100
METRIC RATING
87th/ 347
METRIC RANK
10.0%
NO VEHICLES IN HOUSEHOLD
73.9/ 100
METRIC RATING
150th/ 347
METRIC RANK
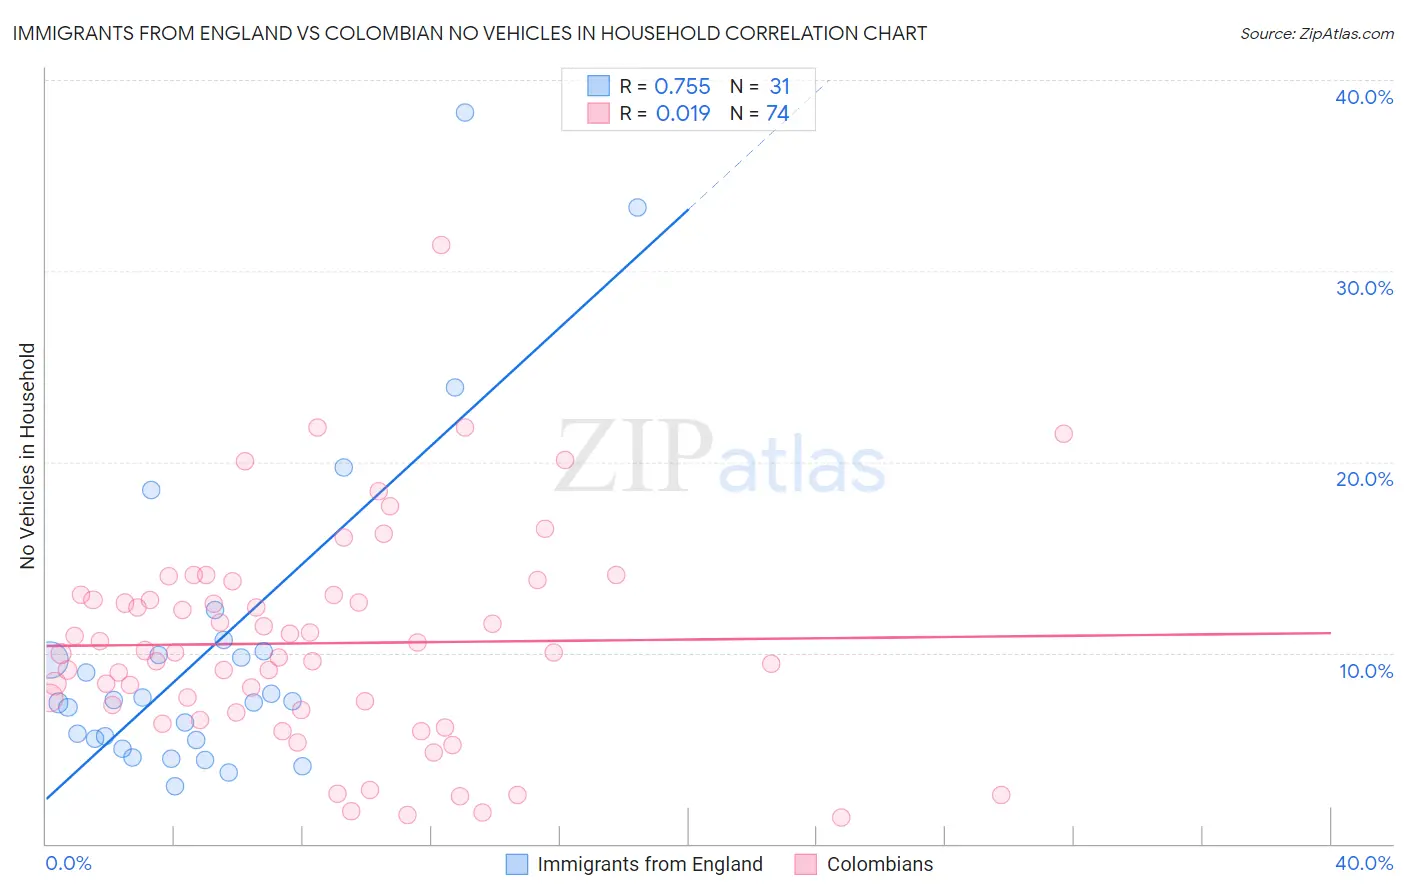
Immigrants from England vs Colombian No Vehicles in Household Correlation Chart
The statistical analysis conducted on geographies consisting of 390,853,276 people shows a strong positive correlation between the proportion of Immigrants from England and percentage of households with no vehicle available in the United States with a correlation coefficient (R) of 0.755 and weighted average of 8.7%. Similarly, the statistical analysis conducted on geographies consisting of 403,339,443 people shows no correlation between the proportion of Colombians and percentage of households with no vehicle available in the United States with a correlation coefficient (R) of 0.019 and weighted average of 10.0%, a difference of 15.6%.
No Vehicles in Household Correlation Summary
| Measurement | Immigrants from England | Colombian |
| Minimum | 3.0% | 1.4% |
| Maximum | 38.3% | 31.4% |
| Range | 35.3% | 30.0% |
| Mean | 10.2% | 10.5% |
| Median | 7.5% | 10.0% |
| Interquartile 25% (IQ1) | 5.4% | 7.0% |
| Interquartile 75% (IQ3) | 10.1% | 13.0% |
| Interquartile Range (IQR) | 4.6% | 6.0% |
| Standard Deviation (Sample) | 8.3% | 5.5% |
| Standard Deviation (Population) | 8.2% | 5.5% |
Similar Demographics by No Vehicles in Household
Demographics Similar to Immigrants from England by No Vehicles in Household
In terms of no vehicles in household, the demographic groups most similar to Immigrants from England are Osage (8.7%, a difference of 0.12%), Bangladeshi (8.7%, a difference of 0.22%), Immigrants from Cuba (8.7%, a difference of 0.26%), Lebanese (8.7%, a difference of 0.33%), and Bhutanese (8.7%, a difference of 0.35%).
| Demographics | Rating | Rank | No Vehicles in Household |
| Bolivians | 99.4 /100 | #80 | Exceptional 8.6% |
| Tsimshian | 99.4 /100 | #81 | Exceptional 8.6% |
| Immigrants | South Eastern Asia | 99.4 /100 | #82 | Exceptional 8.6% |
| Italians | 99.4 /100 | #83 | Exceptional 8.6% |
| Immigrants | Jordan | 99.3 /100 | #84 | Exceptional 8.7% |
| Lebanese | 99.3 /100 | #85 | Exceptional 8.7% |
| Bangladeshis | 99.3 /100 | #86 | Exceptional 8.7% |
| Immigrants | England | 99.2 /100 | #87 | Exceptional 8.7% |
| Osage | 99.2 /100 | #88 | Exceptional 8.7% |
| Immigrants | Cuba | 99.2 /100 | #89 | Exceptional 8.7% |
| Bhutanese | 99.2 /100 | #90 | Exceptional 8.7% |
| Immigrants | Germany | 99.1 /100 | #91 | Exceptional 8.7% |
| Immigrants | Canada | 99.1 /100 | #92 | Exceptional 8.7% |
| Immigrants | North America | 99.1 /100 | #93 | Exceptional 8.7% |
| Austrians | 98.9 /100 | #94 | Exceptional 8.8% |
Demographics Similar to Colombians by No Vehicles in Household
In terms of no vehicles in household, the demographic groups most similar to Colombians are Immigrants from Eastern Africa (10.0%, a difference of 0.010%), Immigrants from Congo (10.1%, a difference of 0.15%), Tlingit-Haida (10.1%, a difference of 0.24%), Sioux (10.1%, a difference of 0.26%), and Salvadoran (10.1%, a difference of 0.27%).
| Demographics | Rating | Rank | No Vehicles in Household |
| Chileans | 81.2 /100 | #143 | Excellent 9.9% |
| Immigrants | Bahamas | 81.2 /100 | #144 | Excellent 9.9% |
| Bahamians | 81.0 /100 | #145 | Excellent 9.9% |
| Hungarians | 80.0 /100 | #146 | Excellent 9.9% |
| Immigrants | Nicaragua | 79.8 /100 | #147 | Good 9.9% |
| Immigrants | Bosnia and Herzegovina | 79.1 /100 | #148 | Good 9.9% |
| Immigrants | Uganda | 76.1 /100 | #149 | Good 10.0% |
| Colombians | 73.9 /100 | #150 | Good 10.0% |
| Immigrants | Eastern Africa | 73.8 /100 | #151 | Good 10.0% |
| Immigrants | Congo | 73.0 /100 | #152 | Good 10.1% |
| Tlingit-Haida | 72.5 /100 | #153 | Good 10.1% |
| Sioux | 72.4 /100 | #154 | Good 10.1% |
| Salvadorans | 72.4 /100 | #155 | Good 10.1% |
| Immigrants | Micronesia | 70.9 /100 | #156 | Good 10.1% |
| Australians | 70.6 /100 | #157 | Good 10.1% |