French vs Colombian No Vehicles in Household
COMPARE
French
Colombian
No Vehicles in Household
No Vehicles in Household Comparison
French
Colombians
7.4%
NO VEHICLES IN HOUSEHOLD
100.0/ 100
METRIC RATING
23rd/ 347
METRIC RANK
10.0%
NO VEHICLES IN HOUSEHOLD
73.9/ 100
METRIC RATING
150th/ 347
METRIC RANK
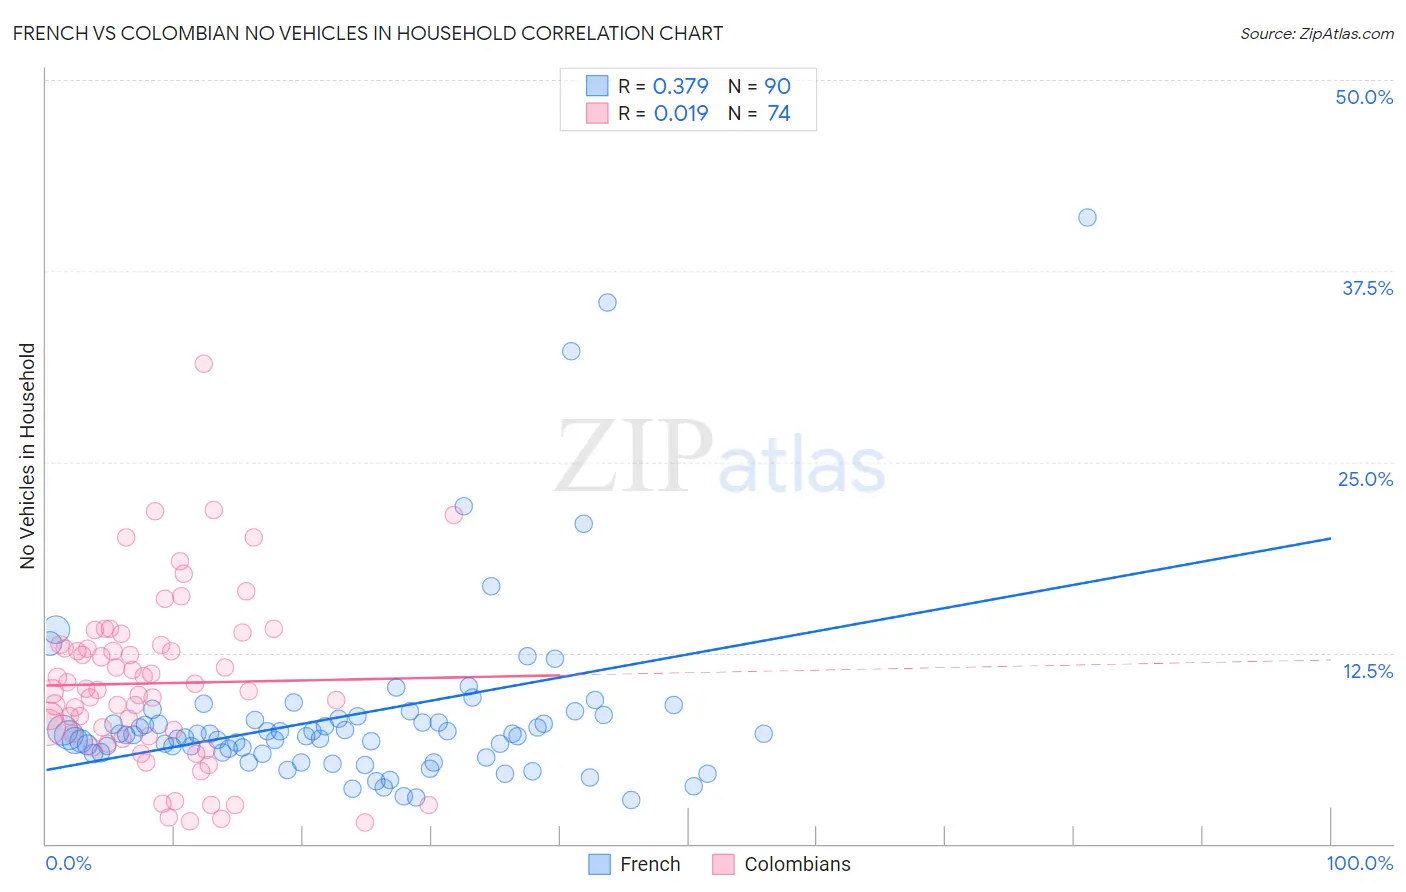
French vs Colombian No Vehicles in Household Correlation Chart
The statistical analysis conducted on geographies consisting of 566,745,799 people shows a mild positive correlation between the proportion of French and percentage of households with no vehicle available in the United States with a correlation coefficient (R) of 0.379 and weighted average of 7.4%. Similarly, the statistical analysis conducted on geographies consisting of 403,339,443 people shows no correlation between the proportion of Colombians and percentage of households with no vehicle available in the United States with a correlation coefficient (R) of 0.019 and weighted average of 10.0%, a difference of 34.9%.
No Vehicles in Household Correlation Summary
| Measurement | French | Colombian |
| Minimum | 2.9% | 1.4% |
| Maximum | 41.0% | 31.4% |
| Range | 38.1% | 30.0% |
| Mean | 8.4% | 10.5% |
| Median | 7.1% | 10.0% |
| Interquartile 25% (IQ1) | 6.0% | 7.0% |
| Interquartile 75% (IQ3) | 8.2% | 13.0% |
| Interquartile Range (IQR) | 2.2% | 6.0% |
| Standard Deviation (Sample) | 6.1% | 5.5% |
| Standard Deviation (Population) | 6.1% | 5.5% |
Similar Demographics by No Vehicles in Household
Demographics Similar to French by No Vehicles in Household
In terms of no vehicles in household, the demographic groups most similar to French are Irish (7.4%, a difference of 0.050%), Immigrants from Iraq (7.5%, a difference of 0.39%), Yaqui (7.5%, a difference of 0.56%), Nepalese (7.4%, a difference of 0.65%), and Ottawa (7.4%, a difference of 0.80%).
| Demographics | Rating | Rank | No Vehicles in Household |
| Europeans | 100.0 /100 | #16 | Exceptional 7.1% |
| Welsh | 100.0 /100 | #17 | Exceptional 7.2% |
| Tongans | 100.0 /100 | #18 | Exceptional 7.2% |
| Arapaho | 100.0 /100 | #19 | Exceptional 7.4% |
| Ottawa | 100.0 /100 | #20 | Exceptional 7.4% |
| Nepalese | 100.0 /100 | #21 | Exceptional 7.4% |
| Irish | 100.0 /100 | #22 | Exceptional 7.4% |
| French | 100.0 /100 | #23 | Exceptional 7.4% |
| Immigrants | Iraq | 100.0 /100 | #24 | Exceptional 7.5% |
| Yaqui | 100.0 /100 | #25 | Exceptional 7.5% |
| Sri Lankans | 100.0 /100 | #26 | Exceptional 7.6% |
| British | 100.0 /100 | #27 | Exceptional 7.6% |
| Samoans | 100.0 /100 | #28 | Exceptional 7.6% |
| Americans | 100.0 /100 | #29 | Exceptional 7.7% |
| Finns | 100.0 /100 | #30 | Exceptional 7.7% |
Demographics Similar to Colombians by No Vehicles in Household
In terms of no vehicles in household, the demographic groups most similar to Colombians are Immigrants from Eastern Africa (10.0%, a difference of 0.010%), Immigrants from Congo (10.1%, a difference of 0.15%), Tlingit-Haida (10.1%, a difference of 0.24%), Sioux (10.1%, a difference of 0.26%), and Salvadoran (10.1%, a difference of 0.27%).
| Demographics | Rating | Rank | No Vehicles in Household |
| Chileans | 81.2 /100 | #143 | Excellent 9.9% |
| Immigrants | Bahamas | 81.2 /100 | #144 | Excellent 9.9% |
| Bahamians | 81.0 /100 | #145 | Excellent 9.9% |
| Hungarians | 80.0 /100 | #146 | Excellent 9.9% |
| Immigrants | Nicaragua | 79.8 /100 | #147 | Good 9.9% |
| Immigrants | Bosnia and Herzegovina | 79.1 /100 | #148 | Good 9.9% |
| Immigrants | Uganda | 76.1 /100 | #149 | Good 10.0% |
| Colombians | 73.9 /100 | #150 | Good 10.0% |
| Immigrants | Eastern Africa | 73.8 /100 | #151 | Good 10.0% |
| Immigrants | Congo | 73.0 /100 | #152 | Good 10.1% |
| Tlingit-Haida | 72.5 /100 | #153 | Good 10.1% |
| Sioux | 72.4 /100 | #154 | Good 10.1% |
| Salvadorans | 72.4 /100 | #155 | Good 10.1% |
| Immigrants | Micronesia | 70.9 /100 | #156 | Good 10.1% |
| Australians | 70.6 /100 | #157 | Good 10.1% |