Maltese vs Haitian No Vehicles in Household
COMPARE
Maltese
Haitian
No Vehicles in Household
No Vehicles in Household Comparison
Maltese
Haitians
9.1%
NO VEHICLES IN HOUSEHOLD
97.6/ 100
METRIC RATING
109th/ 347
METRIC RANK
14.9%
NO VEHICLES IN HOUSEHOLD
0.0/ 100
METRIC RATING
302nd/ 347
METRIC RANK
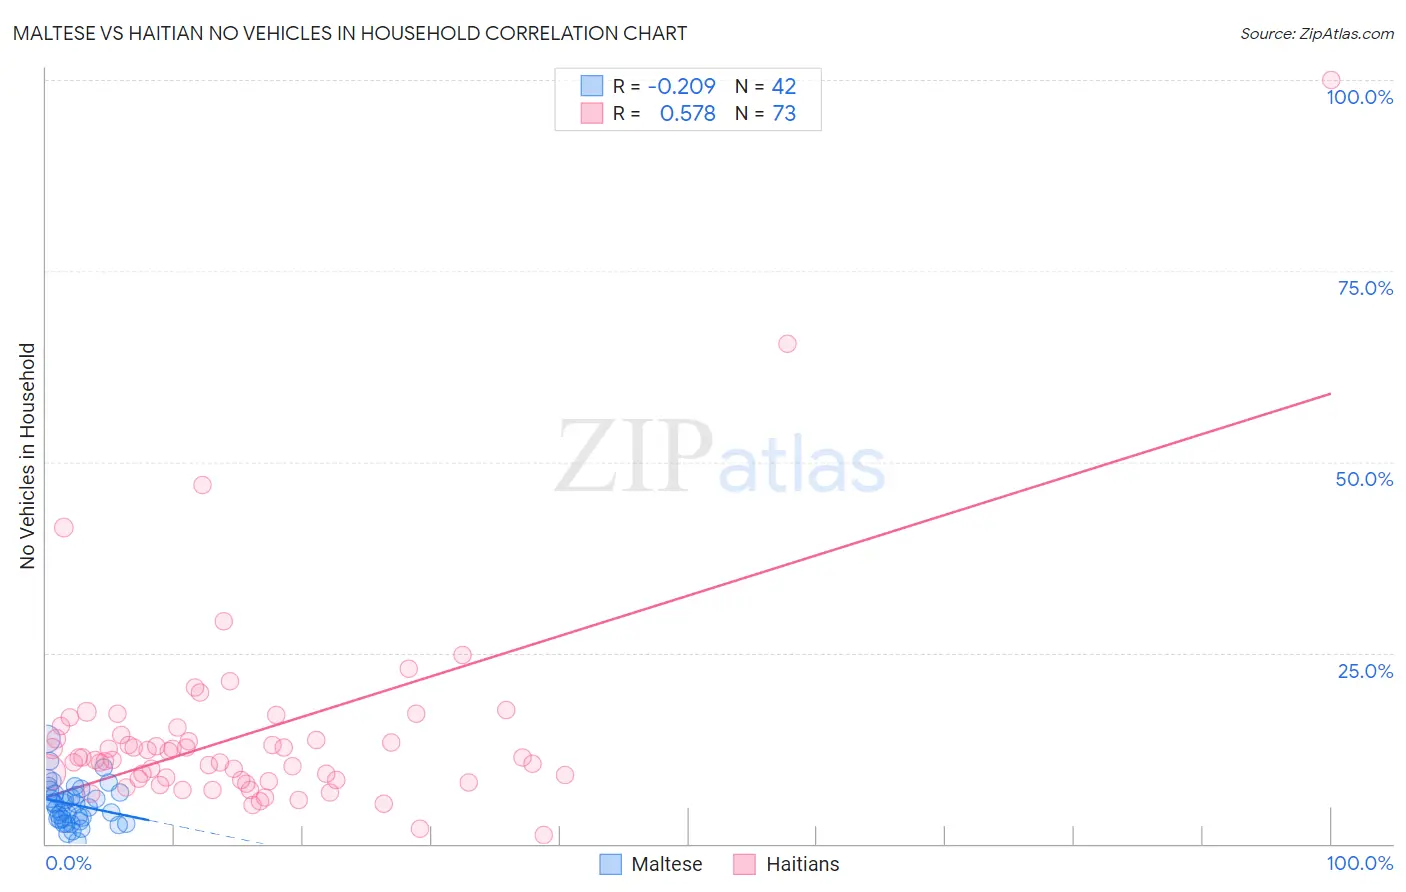
Maltese vs Haitian No Vehicles in Household Correlation Chart
The statistical analysis conducted on geographies consisting of 126,211,459 people shows a weak negative correlation between the proportion of Maltese and percentage of households with no vehicle available in the United States with a correlation coefficient (R) of -0.209 and weighted average of 9.1%. Similarly, the statistical analysis conducted on geographies consisting of 287,450,258 people shows a substantial positive correlation between the proportion of Haitians and percentage of households with no vehicle available in the United States with a correlation coefficient (R) of 0.578 and weighted average of 14.9%, a difference of 63.9%.
No Vehicles in Household Correlation Summary
| Measurement | Maltese | Haitian |
| Minimum | 0.26% | 1.2% |
| Maximum | 13.7% | 100.0% |
| Range | 13.5% | 98.8% |
| Mean | 5.1% | 14.5% |
| Median | 5.0% | 11.3% |
| Interquartile 25% (IQ1) | 3.2% | 8.4% |
| Interquartile 75% (IQ3) | 6.8% | 14.7% |
| Interquartile Range (IQR) | 3.6% | 6.3% |
| Standard Deviation (Sample) | 2.7% | 13.9% |
| Standard Deviation (Population) | 2.7% | 13.8% |
Similar Demographics by No Vehicles in Household
Demographics Similar to Maltese by No Vehicles in Household
In terms of no vehicles in household, the demographic groups most similar to Maltese are Mexican American Indian (9.1%, a difference of 0.13%), Hispanic or Latino (9.1%, a difference of 0.21%), Laotian (9.1%, a difference of 0.48%), Spanish American (9.1%, a difference of 0.57%), and Delaware (9.2%, a difference of 0.58%).
| Demographics | Rating | Rank | No Vehicles in Household |
| Yugoslavians | 98.3 /100 | #102 | Exceptional 9.0% |
| Seminole | 98.3 /100 | #103 | Exceptional 9.0% |
| Zimbabweans | 98.0 /100 | #104 | Exceptional 9.0% |
| Spanish Americans | 97.9 /100 | #105 | Exceptional 9.1% |
| Laotians | 97.8 /100 | #106 | Exceptional 9.1% |
| Hispanics or Latinos | 97.7 /100 | #107 | Exceptional 9.1% |
| Mexican American Indians | 97.6 /100 | #108 | Exceptional 9.1% |
| Maltese | 97.6 /100 | #109 | Exceptional 9.1% |
| Delaware | 97.2 /100 | #110 | Exceptional 9.2% |
| Immigrants | Kuwait | 95.1 /100 | #111 | Exceptional 9.4% |
| Armenians | 95.0 /100 | #112 | Exceptional 9.4% |
| Immigrants | Netherlands | 94.8 /100 | #113 | Exceptional 9.4% |
| Serbians | 94.3 /100 | #114 | Exceptional 9.4% |
| Navajo | 94.2 /100 | #115 | Exceptional 9.4% |
| Japanese | 94.1 /100 | #116 | Exceptional 9.4% |
Demographics Similar to Haitians by No Vehicles in Household
In terms of no vehicles in household, the demographic groups most similar to Haitians are Immigrants from Ukraine (14.9%, a difference of 0.47%), Yuman (14.9%, a difference of 0.48%), Immigrants from Western Africa (15.0%, a difference of 0.52%), Immigrants from Russia (15.1%, a difference of 1.2%), and Immigrants from Greece (14.7%, a difference of 1.5%).
| Demographics | Rating | Rank | No Vehicles in Household |
| Paraguayans | 0.0 /100 | #295 | Tragic 14.4% |
| Immigrants | Spain | 0.0 /100 | #296 | Tragic 14.5% |
| Immigrants | Panama | 0.0 /100 | #297 | Tragic 14.6% |
| Moroccans | 0.0 /100 | #298 | Tragic 14.7% |
| Immigrants | Greece | 0.0 /100 | #299 | Tragic 14.7% |
| Yuman | 0.0 /100 | #300 | Tragic 14.9% |
| Immigrants | Ukraine | 0.0 /100 | #301 | Tragic 14.9% |
| Haitians | 0.0 /100 | #302 | Tragic 14.9% |
| Immigrants | Western Africa | 0.0 /100 | #303 | Tragic 15.0% |
| Immigrants | Russia | 0.0 /100 | #304 | Tragic 15.1% |
| Immigrants | China | 0.0 /100 | #305 | Tragic 15.2% |
| Immigrants | Belize | 0.0 /100 | #306 | Tragic 15.4% |
| Immigrants | Haiti | 0.0 /100 | #307 | Tragic 15.4% |
| U.S. Virgin Islanders | 0.0 /100 | #308 | Tragic 15.4% |
| Puerto Ricans | 0.0 /100 | #309 | Tragic 15.5% |