Immigrants from Belize vs Inupiat No Vehicles in Household
COMPARE
Immigrants from Belize
Inupiat
No Vehicles in Household
No Vehicles in Household Comparison
Immigrants from Belize
Inupiat
15.4%
NO VEHICLES IN HOUSEHOLD
0.0/ 100
METRIC RATING
306th/ 347
METRIC RANK
29.9%
NO VEHICLES IN HOUSEHOLD
0.0/ 100
METRIC RATING
343rd/ 347
METRIC RANK
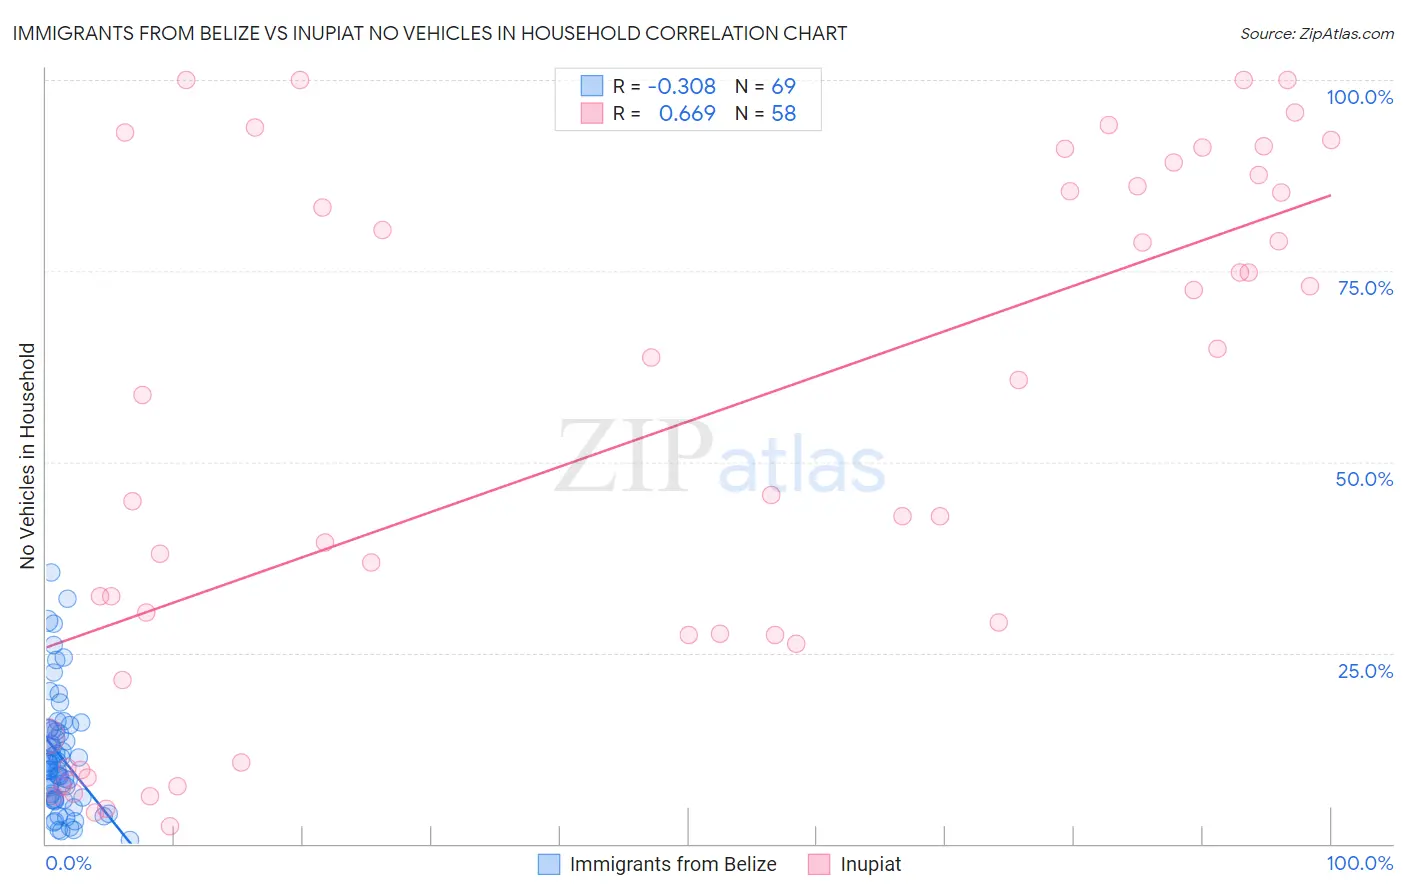
Immigrants from Belize vs Inupiat No Vehicles in Household Correlation Chart
The statistical analysis conducted on geographies consisting of 130,253,773 people shows a mild negative correlation between the proportion of Immigrants from Belize and percentage of households with no vehicle available in the United States with a correlation coefficient (R) of -0.308 and weighted average of 15.4%. Similarly, the statistical analysis conducted on geographies consisting of 96,243,666 people shows a significant positive correlation between the proportion of Inupiat and percentage of households with no vehicle available in the United States with a correlation coefficient (R) of 0.669 and weighted average of 29.9%, a difference of 94.5%.
No Vehicles in Household Correlation Summary
| Measurement | Immigrants from Belize | Inupiat |
| Minimum | 0.48% | 2.2% |
| Maximum | 35.6% | 100.0% |
| Range | 35.1% | 97.8% |
| Mean | 11.4% | 53.1% |
| Median | 10.3% | 52.3% |
| Interquartile 25% (IQ1) | 5.8% | 26.2% |
| Interquartile 75% (IQ3) | 15.0% | 86.0% |
| Interquartile Range (IQR) | 9.3% | 59.9% |
| Standard Deviation (Sample) | 7.7% | 34.0% |
| Standard Deviation (Population) | 7.6% | 33.7% |
Similar Demographics by No Vehicles in Household
Demographics Similar to Immigrants from Belize by No Vehicles in Household
In terms of no vehicles in household, the demographic groups most similar to Immigrants from Belize are Immigrants from Haiti (15.4%, a difference of 0.13%), U.S. Virgin Islander (15.4%, a difference of 0.17%), Puerto Rican (15.5%, a difference of 0.82%), Immigrants from China (15.2%, a difference of 1.3%), and Cape Verdean (15.6%, a difference of 1.4%).
| Demographics | Rating | Rank | No Vehicles in Household |
| Immigrants | Greece | 0.0 /100 | #299 | Tragic 14.7% |
| Yuman | 0.0 /100 | #300 | Tragic 14.9% |
| Immigrants | Ukraine | 0.0 /100 | #301 | Tragic 14.9% |
| Haitians | 0.0 /100 | #302 | Tragic 14.9% |
| Immigrants | Western Africa | 0.0 /100 | #303 | Tragic 15.0% |
| Immigrants | Russia | 0.0 /100 | #304 | Tragic 15.1% |
| Immigrants | China | 0.0 /100 | #305 | Tragic 15.2% |
| Immigrants | Belize | 0.0 /100 | #306 | Tragic 15.4% |
| Immigrants | Haiti | 0.0 /100 | #307 | Tragic 15.4% |
| U.S. Virgin Islanders | 0.0 /100 | #308 | Tragic 15.4% |
| Puerto Ricans | 0.0 /100 | #309 | Tragic 15.5% |
| Cape Verdeans | 0.0 /100 | #310 | Tragic 15.6% |
| Immigrants | Israel | 0.0 /100 | #311 | Tragic 15.6% |
| Alaskan Athabascans | 0.0 /100 | #312 | Tragic 15.6% |
| Tohono O'odham | 0.0 /100 | #313 | Tragic 15.6% |
Demographics Similar to Inupiat by No Vehicles in Household
In terms of no vehicles in household, the demographic groups most similar to Inupiat are British West Indian (29.7%, a difference of 0.41%), Immigrants from Guyana (29.5%, a difference of 1.3%), Immigrants from Barbados (29.5%, a difference of 1.3%), Dominican (29.4%, a difference of 1.5%), and Guyanese (29.3%, a difference of 1.9%).
| Demographics | Rating | Rank | No Vehicles in Household |
| Immigrants | Trinidad and Tobago | 0.0 /100 | #333 | Tragic 24.6% |
| Immigrants | Bangladesh | 0.0 /100 | #334 | Tragic 25.8% |
| Barbadians | 0.0 /100 | #335 | Tragic 26.1% |
| Vietnamese | 0.0 /100 | #336 | Tragic 26.2% |
| Immigrants | Uzbekistan | 0.0 /100 | #337 | Tragic 26.7% |
| Guyanese | 0.0 /100 | #338 | Tragic 29.3% |
| Dominicans | 0.0 /100 | #339 | Tragic 29.4% |
| Immigrants | Barbados | 0.0 /100 | #340 | Tragic 29.5% |
| Immigrants | Guyana | 0.0 /100 | #341 | Tragic 29.5% |
| British West Indians | 0.0 /100 | #342 | Tragic 29.7% |
| Inupiat | 0.0 /100 | #343 | Tragic 29.9% |
| Immigrants | Dominican Republic | 0.0 /100 | #344 | Tragic 31.4% |
| Immigrants | St. Vincent and the Grenadines | 0.0 /100 | #345 | Tragic 35.4% |
| Immigrants | Grenada | 0.0 /100 | #346 | Tragic 37.5% |
| Yup'ik | 0.0 /100 | #347 | Tragic 45.9% |