Immigrants from Belize vs Immigrants from Malaysia 1 or more Vehicles in Household
COMPARE
Immigrants from Belize
Immigrants from Malaysia
1 or more Vehicles in Household
1 or more Vehicles in Household Comparison
Immigrants from Belize
Immigrants from Malaysia
84.7%
1 OR MORE VEHICLES IN HOUSEHOLD
0.0/ 100
METRIC RATING
308th/ 347
METRIC RANK
86.5%
1 OR MORE VEHICLES IN HOUSEHOLD
0.0/ 100
METRIC RATING
287th/ 347
METRIC RANK
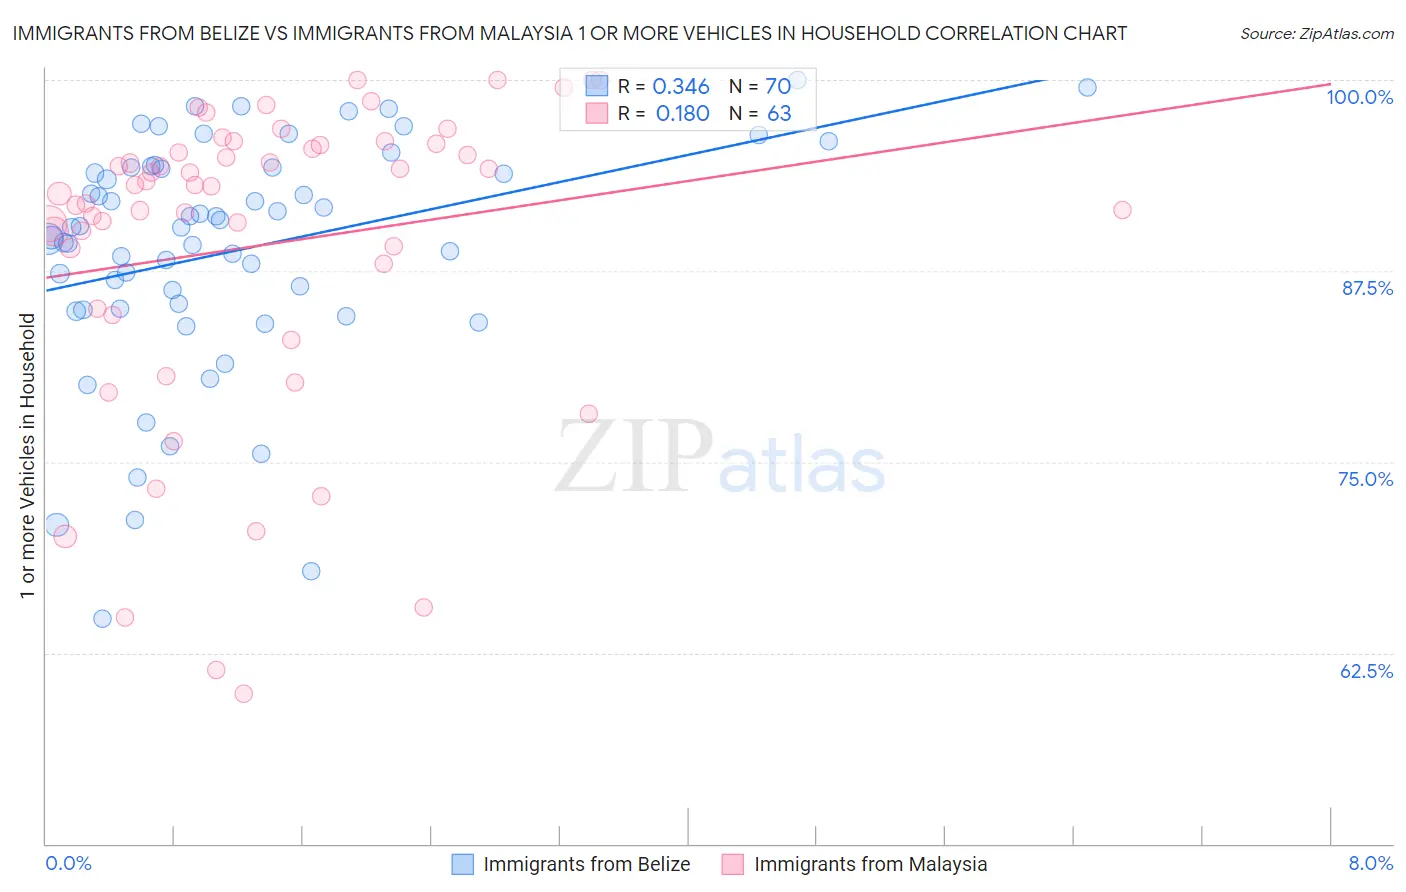
Immigrants from Belize vs Immigrants from Malaysia 1 or more Vehicles in Household Correlation Chart
The statistical analysis conducted on geographies consisting of 130,296,303 people shows a mild positive correlation between the proportion of Immigrants from Belize and percentage of households with 1 or more vehicles available in the United States with a correlation coefficient (R) of 0.346 and weighted average of 84.7%. Similarly, the statistical analysis conducted on geographies consisting of 197,926,465 people shows a poor positive correlation between the proportion of Immigrants from Malaysia and percentage of households with 1 or more vehicles available in the United States with a correlation coefficient (R) of 0.180 and weighted average of 86.5%, a difference of 2.1%.
1 or more Vehicles in Household Correlation Summary
| Measurement | Immigrants from Belize | Immigrants from Malaysia |
| Minimum | 64.7% | 59.8% |
| Maximum | 100.0% | 100.0% |
| Range | 35.3% | 40.2% |
| Mean | 88.8% | 89.2% |
| Median | 90.3% | 93.0% |
| Interquartile 25% (IQ1) | 85.0% | 85.0% |
| Interquartile 75% (IQ3) | 94.3% | 95.7% |
| Interquartile Range (IQR) | 9.2% | 10.7% |
| Standard Deviation (Sample) | 7.7% | 10.1% |
| Standard Deviation (Population) | 7.6% | 10.0% |
Similar Demographics by 1 or more Vehicles in Household
Demographics Similar to Immigrants from Belize by 1 or more Vehicles in Household
In terms of 1 or more vehicles in household, the demographic groups most similar to Immigrants from Belize are Immigrants from Haiti (84.7%, a difference of 0.010%), Tohono O'odham (84.7%, a difference of 0.030%), U.S. Virgin Islander (84.6%, a difference of 0.040%), Puerto Rican (84.6%, a difference of 0.080%), and Cape Verdean (84.5%, a difference of 0.19%).
| Demographics | Rating | Rank | 1 or more Vehicles in Household |
| Immigrants | Panama | 0.0 /100 | #301 | Tragic 85.4% |
| Moroccans | 0.0 /100 | #302 | Tragic 85.4% |
| Immigrants | Greece | 0.0 /100 | #303 | Tragic 85.4% |
| Immigrants | Ukraine | 0.0 /100 | #304 | Tragic 85.2% |
| Immigrants | China | 0.0 /100 | #305 | Tragic 84.9% |
| Immigrants | Western Africa | 0.0 /100 | #306 | Tragic 84.9% |
| Tohono O'odham | 0.0 /100 | #307 | Tragic 84.7% |
| Immigrants | Belize | 0.0 /100 | #308 | Tragic 84.7% |
| Immigrants | Haiti | 0.0 /100 | #309 | Tragic 84.7% |
| U.S. Virgin Islanders | 0.0 /100 | #310 | Tragic 84.6% |
| Puerto Ricans | 0.0 /100 | #311 | Tragic 84.6% |
| Cape Verdeans | 0.0 /100 | #312 | Tragic 84.5% |
| Immigrants | Israel | 0.0 /100 | #313 | Tragic 84.5% |
| Albanians | 0.0 /100 | #314 | Tragic 84.4% |
| Cypriots | 0.0 /100 | #315 | Tragic 84.4% |
Demographics Similar to Immigrants from Malaysia by 1 or more Vehicles in Household
In terms of 1 or more vehicles in household, the demographic groups most similar to Immigrants from Malaysia are Hopi (86.4%, a difference of 0.070%), Immigrants from Eastern Asia (86.5%, a difference of 0.080%), Immigrants from Ireland (86.4%, a difference of 0.090%), Immigrants from Kazakhstan (86.6%, a difference of 0.11%), and Immigrants from Australia (86.4%, a difference of 0.13%).
| Demographics | Rating | Rank | 1 or more Vehicles in Household |
| Immigrants | Croatia | 0.0 /100 | #280 | Tragic 87.0% |
| Mongolians | 0.0 /100 | #281 | Tragic 87.0% |
| Colville | 0.0 /100 | #282 | Tragic 86.8% |
| Immigrants | Eastern Europe | 0.0 /100 | #283 | Tragic 86.7% |
| Central American Indians | 0.0 /100 | #284 | Tragic 86.7% |
| Immigrants | Kazakhstan | 0.0 /100 | #285 | Tragic 86.6% |
| Immigrants | Eastern Asia | 0.0 /100 | #286 | Tragic 86.5% |
| Immigrants | Malaysia | 0.0 /100 | #287 | Tragic 86.5% |
| Hopi | 0.0 /100 | #288 | Tragic 86.4% |
| Immigrants | Ireland | 0.0 /100 | #289 | Tragic 86.4% |
| Immigrants | Australia | 0.0 /100 | #290 | Tragic 86.4% |
| Pima | 0.0 /100 | #291 | Tragic 86.3% |
| Okinawans | 0.0 /100 | #292 | Tragic 86.1% |
| Indians (Asian) | 0.0 /100 | #293 | Tragic 86.0% |
| Alaskan Athabascans | 0.0 /100 | #294 | Tragic 86.0% |