Immigrants from Bangladesh vs Bolivian No Vehicles in Household
COMPARE
Immigrants from Bangladesh
Bolivian
No Vehicles in Household
No Vehicles in Household Comparison
Immigrants from Bangladesh
Bolivians
25.8%
NO VEHICLES IN HOUSEHOLD
0.0/ 100
METRIC RATING
334th/ 347
METRIC RANK
8.6%
NO VEHICLES IN HOUSEHOLD
99.4/ 100
METRIC RATING
80th/ 347
METRIC RANK
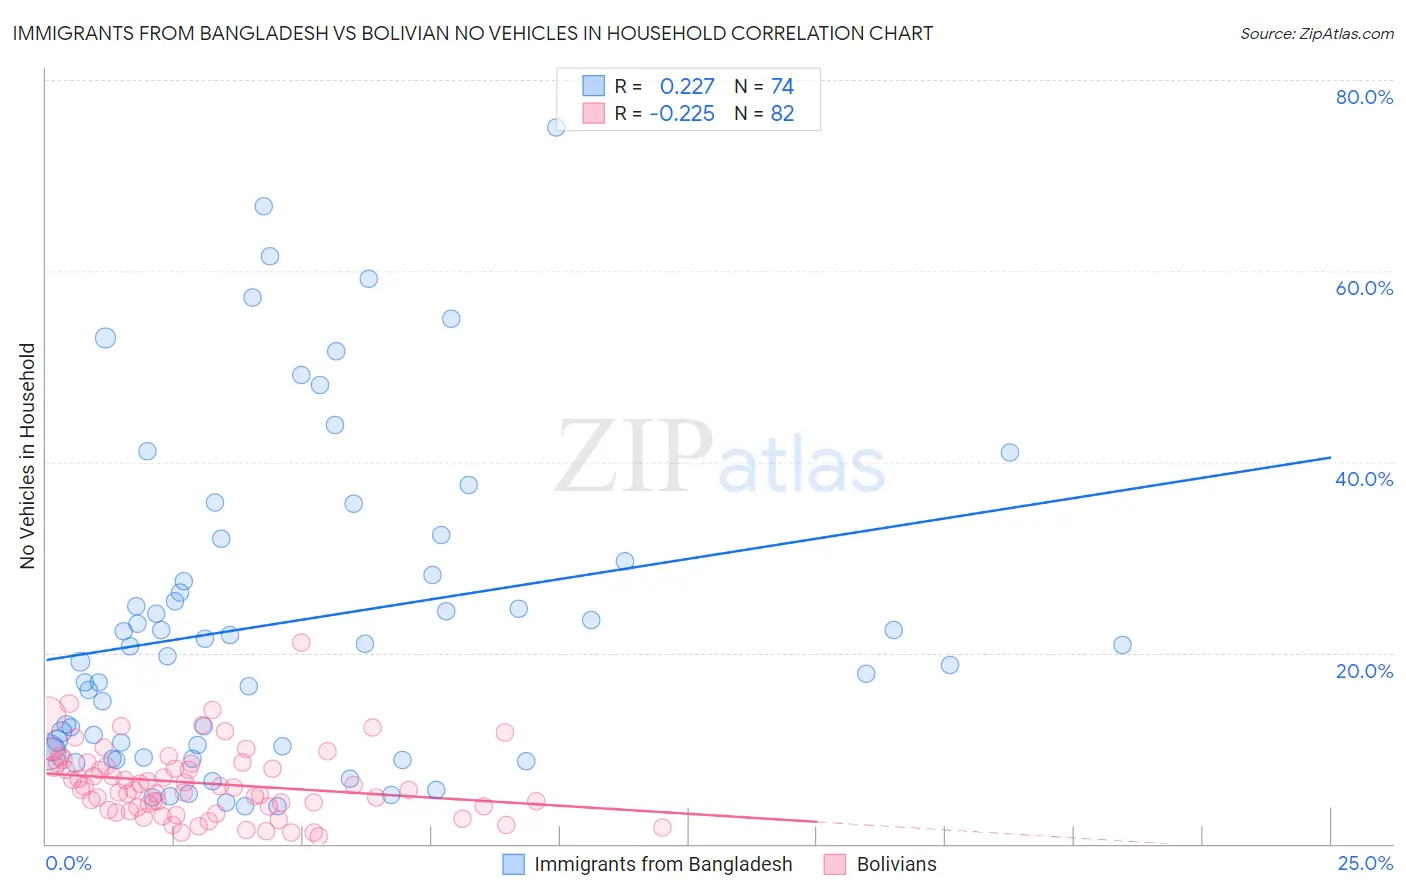
Immigrants from Bangladesh vs Bolivian No Vehicles in Household Correlation Chart
The statistical analysis conducted on geographies consisting of 203,492,873 people shows a weak positive correlation between the proportion of Immigrants from Bangladesh and percentage of households with no vehicle available in the United States with a correlation coefficient (R) of 0.227 and weighted average of 25.8%. Similarly, the statistical analysis conducted on geographies consisting of 184,519,669 people shows a weak negative correlation between the proportion of Bolivians and percentage of households with no vehicle available in the United States with a correlation coefficient (R) of -0.225 and weighted average of 8.6%, a difference of 200.0%.
No Vehicles in Household Correlation Summary
| Measurement | Immigrants from Bangladesh | Bolivian |
| Minimum | 3.9% | 0.83% |
| Maximum | 75.0% | 21.0% |
| Range | 71.1% | 20.2% |
| Mean | 23.3% | 6.3% |
| Median | 20.2% | 5.8% |
| Interquartile 25% (IQ1) | 9.9% | 3.7% |
| Interquartile 75% (IQ3) | 29.6% | 8.4% |
| Interquartile Range (IQR) | 19.7% | 4.6% |
| Standard Deviation (Sample) | 17.0% | 3.7% |
| Standard Deviation (Population) | 16.9% | 3.7% |
Similar Demographics by No Vehicles in Household
Demographics Similar to Immigrants from Bangladesh by No Vehicles in Household
In terms of no vehicles in household, the demographic groups most similar to Immigrants from Bangladesh are Barbadian (26.1%, a difference of 1.3%), Vietnamese (26.2%, a difference of 1.9%), Immigrants from Uzbekistan (26.7%, a difference of 3.5%), Immigrants from Trinidad and Tobago (24.6%, a difference of 4.5%), and Immigrants from Ecuador (23.8%, a difference of 8.1%).
| Demographics | Rating | Rank | No Vehicles in Household |
| Immigrants | Senegal | 0.0 /100 | #327 | Tragic 21.1% |
| Immigrants | Dominica | 0.0 /100 | #328 | Tragic 22.2% |
| Ecuadorians | 0.0 /100 | #329 | Tragic 22.8% |
| West Indians | 0.0 /100 | #330 | Tragic 23.7% |
| Trinidadians and Tobagonians | 0.0 /100 | #331 | Tragic 23.7% |
| Immigrants | Ecuador | 0.0 /100 | #332 | Tragic 23.8% |
| Immigrants | Trinidad and Tobago | 0.0 /100 | #333 | Tragic 24.6% |
| Immigrants | Bangladesh | 0.0 /100 | #334 | Tragic 25.8% |
| Barbadians | 0.0 /100 | #335 | Tragic 26.1% |
| Vietnamese | 0.0 /100 | #336 | Tragic 26.2% |
| Immigrants | Uzbekistan | 0.0 /100 | #337 | Tragic 26.7% |
| Guyanese | 0.0 /100 | #338 | Tragic 29.3% |
| Dominicans | 0.0 /100 | #339 | Tragic 29.4% |
| Immigrants | Barbados | 0.0 /100 | #340 | Tragic 29.5% |
| Immigrants | Guyana | 0.0 /100 | #341 | Tragic 29.5% |
Demographics Similar to Bolivians by No Vehicles in Household
In terms of no vehicles in household, the demographic groups most similar to Bolivians are Tsimshian (8.6%, a difference of 0.050%), Portuguese (8.6%, a difference of 0.15%), Immigrants from South Eastern Asia (8.6%, a difference of 0.18%), Immigrants from South Central Asia (8.6%, a difference of 0.20%), and Iranian (8.6%, a difference of 0.32%).
| Demographics | Rating | Rank | No Vehicles in Household |
| Poles | 99.6 /100 | #73 | Exceptional 8.4% |
| Cubans | 99.5 /100 | #74 | Exceptional 8.5% |
| Jordanians | 99.5 /100 | #75 | Exceptional 8.5% |
| Immigrants | Philippines | 99.5 /100 | #76 | Exceptional 8.5% |
| Iranians | 99.5 /100 | #77 | Exceptional 8.6% |
| Immigrants | South Central Asia | 99.5 /100 | #78 | Exceptional 8.6% |
| Portuguese | 99.5 /100 | #79 | Exceptional 8.6% |
| Bolivians | 99.4 /100 | #80 | Exceptional 8.6% |
| Tsimshian | 99.4 /100 | #81 | Exceptional 8.6% |
| Immigrants | South Eastern Asia | 99.4 /100 | #82 | Exceptional 8.6% |
| Italians | 99.4 /100 | #83 | Exceptional 8.6% |
| Immigrants | Jordan | 99.3 /100 | #84 | Exceptional 8.7% |
| Lebanese | 99.3 /100 | #85 | Exceptional 8.7% |
| Bangladeshis | 99.3 /100 | #86 | Exceptional 8.7% |
| Immigrants | England | 99.2 /100 | #87 | Exceptional 8.7% |